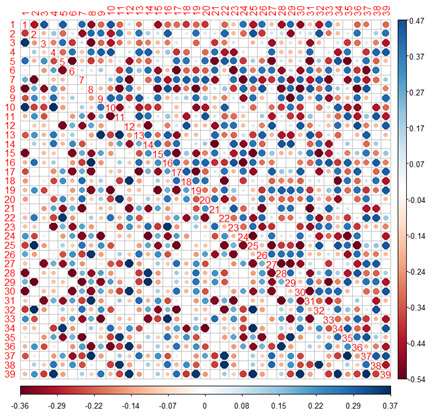
Figure 2. Upper triangle: the estimated beta totally. Lower triangle: the estimated beta for Session 1