| Table 1: Demographic Features of the Study
Group |
Number of Subjects
|
1936 |
Sex
|
980 (50.6%) males
956 (49.6%)female |
Age
|
40.73±11.84 (min 18, max.65) |
Habitation
|
1691 (87.3%) Urban
245 (12.7%) Rural |
Education Year (mean)
|
8.91±3.99 years (min 1,
max.18)
47 (3.5%) literate
21 (1.1%) illiterate |
Marital Status
|
1554 (80.6%) married
19 (1.0%) divorced
86 (4.4%) widow
277 (14.3 %) single |
| SES |
265 (13.7%) Well
540 (27.4%) Medium
621 (32.1%) Low
510 (26.3%) Very Low |
|
|
|
| Table 2: The Anthropometric
Measurements |
| |
Males |
Females |
| |
Mean |
SD |
Mean |
SD |
Height
|
172.51 |
6.92 |
159.33 |
6.63 |
Weight
|
80.20 |
13.56 |
69.19 |
13.55 |
WC (cm)
|
95.56 |
11.27 |
85.19 |
13.07 |
WHR
|
0.92 |
0.31 |
0.80 |
0.37 |
| BMI kg/cm² |
26.89 |
4.17 |
27.46 |
5.58 |
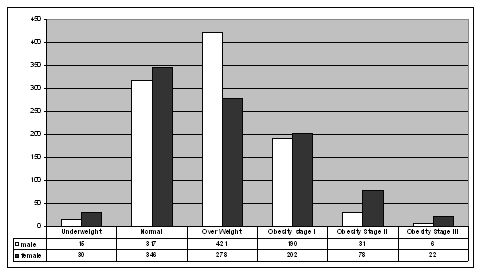
Figure 1: Obesity
Classification According To BMI
|
|
|
|