|
QUS
measurements in dialysis patients
|
|

Authors:
1 Ismail Hamdi KARA, 2 Mehmet Emin YILMAZ, 3 Kenan TURGUTALP,
4 Alparslan TUZCU, 3 Ali Kemal KADIROGLU.
1 Assoc. Prof. Dr. in Department of
Family Practice, and staff at the Hemodialysis Center between
1999-2003,
2 Assoc. Prof. Dr. in Department of Nephrology, and Director
of the Hemodialysis Center,
3 Resident Dr. in Department of Internal Medicine,
4 Assist. Prof. Dr. in Department of Endocrinology, from Dicle
University Medical School, Diyarbakir, Turkey.
Correspondence:
Dr. Ismail H. KARA
Dicle Üniversitesi Hastanesi, Aile Hekimligi ABD.
21280 Diyarbakir / TURKEY
Phone: 011 90 412 248 8001 / 4255 (hospital) and 011
90 533 578 8243 (Mobil)
Fax: 011 90 412 248 8440
E-mail: ihkara13@hotmail.com

ABSTRACT
Background: It was aimed to evaluate
the bone measurements by quantitative heel ultrasound (QUS)
in patients undergoing chronic haemodialysis (HD) and continuous
ambulatory peritoneal dialysis (CAPD), and healthy controls.
It was also aimed to investigate the relationship between
weight, body mass index (BMI), smoking and parathyroid hormone
(PTH) with QUS parameters.
Method: Present study included 25 patients
on chronic HD (Group 1), 16 patients treated by CAPD (Group
2) and 32 controls (Group 3). QUS (Hologic, Sahara bone sonometer)
measured broadband ultrasound attenuation (BUA; dB/Mhz), quantitative
ultrasound index (QUI; g/cm2), speed of sound (SOS; m/s).
The WHO (1997) classification of BMI was used for weight classification.
The smoking criterion was defined as smoker and non-smoker.
Results: Mean age of cases was 40.2±15.5,
36.0±9.9 and 36.6±12.4 years, in groups 1, 2
and 3 (p>0.05), and mean dialysis duration time was 31.8±12.6
and 42.8±12.8 months, in groups 1 and 2 (p=0.015).
Depending on the QUS parameters, both osteoporosis and osteop
zenia were diagnosed in five (56%) of women and in 11 (69%)
of men in HD vs in two (33%) of women and in four (40%) of
men in CAPD, respectively (p=0.584). QUS measurements were
not correlated with serum PTH and BMI in both HD and CAPD
groups, respectively. In HD group, we found SOS to be lower
(1526±27 vs. 1548±19 m/s, p=0.016) in smokers
compared to non-smokers. There were negative correlations
between smoking and QUS parameters (r= -0.34; p= 0.044).
Conclusion: Our findings suggest that
there is an unfavorable influence of HD and smoking on bone
mineralization compared to CAPD.

Key words: Quantitative heel ultrasound
(QUS); osteoporosis; continuous ambulatory peritoneal dialysis
(CAPD), haemodialysis (HD); parathyroid hormone (PTH).

INTRODUCTION
Reduced bone mineral density (BMD) is associated
with renal osteodystrophy (ROD) and osteoporosis in end-stage
renal disease (ESRD) patients. On the other hand, ROD is very
heterogeneous, and is characterized by high as well as by
low bone turnover disease [1,2]. The currently accepted definition
of osteoporosis is "a systemic skeletal disease characterized
by low bone mass and microarchitectural deterioration of bone
tissue with consequent increase in bone fragility and susceptibility
to fracture risk" [3].
The underweight state is associated with malnutrition
and osteoporosis; other factors occurring in malnutrition,
besides body composition changes, such as protein deficiency,
could be involved in the association between underweight and
osteoporosis. Persons who are underweight [Body Mass Index
(BMI <18.5)] are at increased risk of osteoporosis and
fracture risk. Reduction of body weight has been shown to
reduce these risks [4]. In addition, some recent studies demonstrate
corresponding positive associations between moderate overweight
and bone mass and density in the elderly [5,6].
Dual-energy X-ray absorptiometry (DEXA) is the
standard non-invasive method to assess BMD, but is not always
widely available. Quantitative heel ultrasound (QUS) is a
mobile, relatively inexpensive, easy to perform and radiation-free
method, which can predict fractures to the same extent as
DEXA [1]. Large prospective studies have demonstrated the
strong exponential relationship between heel ultrasound and
X-ray results and the risk of fracture [7-11]. According to
2002 clinical practice guidelines for the diagnosis and management
of osteoporosis in Canada, it was accepted that "QUS
may be considered for diagnosis of osteoporosis, but not for
follow-up at this time" [12].
The aim of the study was to evaluate the bone
measurements by QUS in chronic haemodialysis (HD) and continuous
ambulatory peritoneal dialysis (CAPD) and healthy controls.
Additionally, we also aimed to determine the effect of weight,
classified by BMI, smoking and biochemical parameters such
as PTH on QUS parameters.
SUBJECTS & METHODS
Subjects
In present descriptive study, 25 patients [16
Male (M), 9 Female (F)] on chronic HD and 16 patients (10
M, 6 F) treated by CAPD in Dialysis Centre of Dicle University,
and 32 healthy controls (15 M, 17 F) were studied. Forty-one
(26 M, 15 F) HD and CAPD patients for at least 6 months and
with dialysis efficiency >1.0 measured by KT/V were included
in the study. The investigation was conducted in accordance
with the local ethics committee and the Declaration of Helsinki
II and the Guidelines of Good Clinical Practice. None of the
studied patients had suffered fractures of long bones, and
none of the patients had undergone partial parathyroidectomy
for severe secondary hyperparathyroidism. Gastric acid suppression
therapy (either H2 receptor antagonists or proton pump inhibitors)
was being taken by three HD patients, and warfarin therapy
was being taken by only one CAPD patient. None of the post-menopausal
females were receiving hormone therapy (HT). All patients
were receiving daily <500 mg dietary calcium and RhuEPO
therapy (Epoetine alpha or beta, weekly mean dose as 2840±2400
IU Sc.) except two patients in CAPD and five patients in HD
groups.
Haemodialysis: The patients received HD this
for 5 hours, three times per week with a high-flux PS hollow
fiber disposable dialyser (Fresenius Medical Care, Germany)
and dialysers were never reused. HD was carried out using
Braun-Dialog and Fresenius-4008S (Germany) dialysis machines
and bicarbonate as dialysate. All patients were receiving
heparin [low molecule weight heparin (LMWH)]. Machines were
heat disinfected between treatments and chemically every month.
There were no major changes in dialysis dose and efficiency
during either study period.
Continuous ambulatory peritoneal dialysis: Most
CAPD patients were prescribed four 2-liter exchanges daily.
A minority were treated with four 1.5-liter exchanges daily
if they couldn't tolerate 2 liters in the peritoneum. All
patients received peritoneal dialysis via a Tenckhoff coil
catheter. CAPD patients used a Baxter's Ultra Bag system (Baxter
Healthcare Corp., USA) or Fresenius' Freedom Y-set system
(Fresenius Medical Care, Germany).
Methods
Laboratory methods: Blood samples were
collected after an overnight fast and before breakfast in
CAPD patients and controls, and immediately before dialysis
session in HD patients. Serum intact parathyroid hormone (1-84)
(iPTH) (normal range: 10-55 pg/ml) was measured by RIA (Immulite
2000, DPC, Los Angeles, USA). Serum calcium (Ca+2) (normal
values range from 8.5 to 10.9 mg/dl), phosphate (P) (normal
range: 2.4 to 4.1 mg/dl) and alkaline phosphatase (ALP) (normal
range: 44 to 147 IU/L) were analysed standard laboratory methods.
Standard medications such as calcium carbonate (CaCO3), or
calcium acetate (PhosEX®), were prescribed with meals
and snacks to bind phosphorus in the bowel. 1,25 (OH)2D3 (calcitriol)
or 1 alpha (OH)D3 (alpha calcidol) was administered orally
at a low dose (0.25 mcg/day), or at a higher dose (0.5 to
1.0 mcg/day) (n=15, HD Group and n=6, CAPD Group).
Definition of Osteoporosis: The WHO definition
was not suitable for use with SOS measurements, therefore
definition of osteoporosis was stated according to study of
Knapp et al [13]. Revised T-score thresholds for the diagnosis
of osteoporosis of -2.6 and for osteopenia of -1.4 were used.
Bone mineral density: Quantitative ultrasound
of the left heel examination was performed by measurement
of broadband ultrasound attenuation (BUA, dB/MHz), speed of
sound (SOS, m/s), and QUI [QUS index defined as (0.67 BUA)
+ (0.28 SOS)] using the Sahara Clinical Bone Sonometer (Hologic
Inc, Bedford, MA, USA) by a single operator. There is no cutoff
level for osteoporosis criterion specific for men and women.
The reported coefficients of variance (CV) for
estimated BMD, QUI, SOS, and BUA are 3, 2.6, 0.22, and 3.7%,
respectively [14]. One measurement of the left foot was obtained
on all participants. A second measurement with repositioning
of the foot was obtained if the first measurement was technically
inadequate.
Some limitations of this study deserve comment.
First, QUS measurements may lack precision especially if the
room temperature varies. To avoid this, the sonometer was
calibrated with a standardized phantom daily and showed an
in vitro precision error of 0.85% for BUA and 0.50% for SOS
during the study period. We examined the subjects after at
least 30 min rest in the test room, where the temperature
was maintained at 25 0C.
System components: The key components
of the sahara advanced clinical bone sonometer system include
the ultrasound unit (including positioning aid), power supply,
power cord, QC phantom, sahara ultrasound coupling gel, and
an external desktop or laptop Windows-based PC.
Obesity: The WHO (1997) classification of BMI
was used for weight classification, i.e. underweight (BMI
<18.5), normal weight (BMI 18.5-24.99), and overweight
as moderate overweight (BMI 25.0-29.99) and obese subjects
(BMI 30+). Weight is measured before and after dialysis in
all patients. The weight used in this study was the average
of three post-dialysis weights recorded in the week prior
to entry.
Smoking status: The smoking criterion
was defined as non-smoker included "all time non-smoker",
"stopped smoking", and "less than 10 Per day",
and current smokers included "between 10 and 20 per day",
and "a pack or greater per day" at least five years.
Smokers were compared to non-smokers.
Statistical methods
Analyses were done by SPSS (Statistical Package
for Social Sciences) 7.5 PC program. Results were expressed
as mean±SD. The one-way ANOVA and post hoc Bonferroni
tests were used to compare independent-unpaired parametric
samples of different groups and the Pearson correlation test
was used to determine the correlations. Differences between
the means of multiple subgroups were assessed with a Kruskal-Wallis
test and the Spearman correlation tests were used to determine
the non-parametric correlations. Logistic regression analyses
were performed with adjustment for clinical (dialysis type,
PTH and smoking status), anthropometric (weight, age, gender
and BMI) and QUS variables. A p<0.05 was considered statistically
significant.
RESULTS
Socio-demographic, biochemical and QUS parameters
of HD, CAPD and Control groups are given in Table 1. Twenty-five
HD patients as group 1 (36.6% women), 16 CAPD patients as
group 2 (37.5% women) and 32 healthy controls as group 3 (53.1%
women) were studied. Mean age of cases was 40.2±15.5,
36.0±9.9 and 36.6±12.4 years, in groups 1, 2
and 3 (p>0.05), and mean dialysis duration time was 31.8±12.6
and 42.8±12.8 months, in groups 1 and 2 (p=0.015),
respectively. Depending on the QUS parameters, both osteoporosis
and osteopenia were diagnosed in five (56%) of women and in
11 (69%) of men in HD vs in two (33%) of women and in four
(40%) of men in CAPD, respectively (p=0.584).
In HD patients (group 1) compared to other groups,
the serum Ca+2 levels, BMI (p=0.291, p=0.001) and QUS parameters
such as BUA (Figure 1) and QUI (p=0.015 and p=0.208) were
lower. However, serum PTH (Figure 2) and ALP levels were higher
(p<0.0001, p=0.001). Bone measurements were not correlated
with serum PTH and BMI in HD group (r=0.24; p=0.314 and r=0.18;
p=0.395) and CAPD group (r=0.09; p=0.753 and r=-0.239; p=0.373),
respectively. We did not find any significant correlations
between QUS parameters and PTH, dialysis duration, gender,
age and menopause in both HD and CAPD groups. Additionally,
there were not associations between BUA values and serum intact
PTH values, duration time of HD, age and gender.
Depending on the WHO weight classification, underweight (BMI
<18.5) vs. normal or overweight (BMI =18.5) condition was
observed as 9/16, 6/10 and 0/32 in HD, CAPD and Control groups
(p=0.001), respectively (Figure 3).
We divided also both CAPD and HD patients into
two groups according to BMI: group A (BMI <18.5 kg/cm2),
and group B (BMI =18.5 kg/cm2); [Group A (n=9) and group B
(n=16) in CAPD and group A (n=6) and group B (n=10) HD patients].
Data related with BMI subgroups were showed in table 2. Mean
BUA value was higher in CAPD groups A and B (p=0.003, Figure
4). We separated both CAPD and HD patients into two groups:
group A (iPTH < 200 pg/mL), and group B (iPTH =200 pg/mL);
[Group A (n=9) and group B (n=7) in CAPD and group A (n=9)
and group B (n=16) HD patients]. However, we did not find
any correlation between PTH levels and QUS parameters both
in two sub-groups of CAPD and HD patients. Data related with
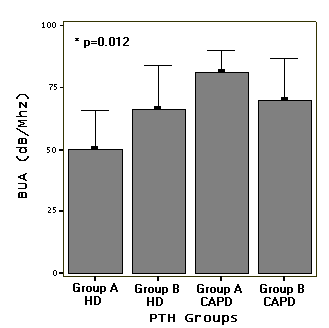
PTH subgroups were showed in table 3. Mean BUA value was lower
in HD group A (Figure 5).
In HD group, there were differences in QUI,
BUA and T score of the calcaneus between smokers and non-smokers.
However, there was significant difference in only SOS (1526±27
vs. 1548±19 m/sn, p=0.016) and Z score (-1.48±0.59
vs. -0.82±0.58, p=0.031). There was a slight positive
correlation between smoking and T score (r=0.35; p=0.044).
However, there were negative correlations between smoking
and QUS parameters (r=-0.34; p=0.044). Bone mass as assessed
by ultrasound of the left heel was lower for SOS (p=0.016)
and QUI (p=0.056) in smokers than in non-smokers (Table 4).
Increased OR was found only for smoking and dialysis type
(HD). The adjusted OR and 95% confidence interval (CI) for
osteoporosis were 4.96 (95% CI: 1.16-24.79) for smoking, and
2.81 (95% CI: 1.05-8.37) for dialysis type (HD) (p=0.008 and
p=0.024). The weight was not quite significant (OR = 0.94,
95% CI 0.87-1.02).
DISCUSSION
Uremia and HD are associated with a high frequency
of ROD, and osteodensitometry has shown decreased BMD and
BMC in patients compared with controls [15]. Frequency of
osteoporosis in patients on dialysis varies in different studies
depending of method and measured region of BMD (16-22). In
the study of Taal et al. [19], the prevalence of femoral neck
BMD below the fracture threshold was 19.3%.
In our study, depending on the QUS parameters,
both osteoporosis and osteopenia were diagnosed in five (56%)
of women and in 11 (69%) of men in HD vs. in two (33%) of
women and in four (40%) of men in CAPD, respectively (p=0.584).
We have also found a moderate however significant reduction
in mean BUA in present chronic HD patients compared to CAPD
patients and healthy controls (p=0.015). The average Z-score
of -1.12 for the QUS measurement of the calcaneus implies
that these patients are only moderately worse off than CAPD
patients and age-matched controls. This is similar to the
results of other studies using different methods of BMD measurement
[20,21].
In a recent study from Turkey, Arici and his
colleagues [23] evaluated the diagnostic potential of QUS
of calcaneum and to correlate it with DEXA in chronic HD patients.
They reported that BUA and SOS values were markedly reduced
in dialysis patients compared to controls (59.1±13.8
vs. 73.0±16.2 dB/MHz, p<0.001 and 1533±28
vs. 1560±29 m/s, p=0.014). Both BUA and SOS scores
were inversely correlated with age (r=-0.69, p<0.001) and
duration of menopause (r=-0.74). Additionally, BUA values
showed a moderate negative association with serum intact PTH
values (r=-0.38, p=0.018). They concluded that chronic HD
patients have reduced calcaneal BUA and SOS values.
As with previous studies [23,24], our findings
also showed that dialysis affects the bone status and HD patients
have worse bone mineral metabolism compared to age and gender
matched CAPD patients and healthy controls. In our study,
mean BUA of HD patients (61±17 dB/Mhz) was significantly
lower than those of CAPD patients (69±17 dB/Mhz) and
controls (74±14 dB/Mhz), respectively (p=0.015) (Figure
1). As it is expected, the mean ALP and PTH levels significantly
higher in HD patients (p<0.0001 and p<0.0001) (Table
1, Figure 2). QUI and BUA were also lowest in HD patients
compared to the other two groups (p=0.208 and p=0.015). We
did not find any significant correlations between BUA and
PTH, dialysis duration, gender and age in both HD and CAPD
groups. Hormonal factors also affect bone density in HD patients.
It was reported that female sex was negatively associated
with total hip BMD in the group as a whole and in the subgroup
of patients over 60 years [19]. However, we were unable to
show any effect of menopause on QUS parameters in HD or CAPD
patients in the present study.
Caloric imbalance (intake exceeding expenditure)
can lead to overweight and obesity. It is well established
that obesity is also a risk factor for a number of serious
disorders. However, moderate overweight plays a protective
role for osteoporosis [6]. Studies in HD patients have not
assessed patient weight; some recent studies have reported
a positive association between BMI and measures of BMD [19].
According to BMI, nine (36%) of 25 HD patients and six (37.5%)
of 16 CAPD patients were underweight (BMI <18.5 kg/m2).
However, none of controls were underweight (Figure 3). We
did not found any association between BMI and BUA in our three
groups. We divided also both CAPD and HD patients into two
groups according to BMI (Table 2). Mean BUA value was higher
in CAPD groups A and B (p=0.003, Fig. 4).
Secondary hyperparathyroidism remains the most
common type of renal bone disease found in HD patients. Several
studies have reported a similar negative association between
PTH levels using a variety of measurements of BMD [19,20,25-27].
In the present study, however, we did not find any significant
correlations between BUA and iPTH, dialysis duration, gender,
age and menopause in both HD and CAPD groups. Additionally,
there were not associations between BUA values and serum intact
PTH values, duration time of HD, age and gender. Similarly
with our results, previously it was reported that bone measurements
were not correlated with serum PTH in patients on maintenance
HD. The regression lines of SOS, BUA, and stiffness to BMD
were not significantly different from that of the controls
[28]. According to study of Peretz and colleagues [28], when
dividing the patients into two subgroups according to their
median PTH (203 pg/mL), the slopes of the regression lines
of BUA to BMD were significantly different between these two
subgroups (p=0.052). Similar correlation also was reported
by other researchers [29,30]. One of them, Pecovnik Balon
and co-workers [29] suggested that there is a negative correlation
between iPTH and BMDc in patients beginning HD treatment (r=-0.34,
p<0.02). Pasadakis and coworkers [30] tried to evaluate
any correlation between BMD and iPTH levels in CAPD patients
that were separated into two groups: group A (iPTH <200
pg/mL), 13 patients, and group B (iPTH >200 pg/mL), 20
patients. Data analysis revealed a negative correlation between
PTH levels and BMD values (r= -0.66, p=0.014) as PTH and serum
calcium (r= -0.77, p=0.002) only in-group A. No other statistically
significant changes were observed. They considered that these
findings suggest there is a favorable influence of CAPD modality
on bone mineralization, while no special DEXA findings are
representative of the possible appearance of a dynamic bone
disease [30].
In the present study, we also separated both
CAPD and HD patients into two groups: group A (PTH =200 pg/mL)
and group B (PTH >200 pg/mL). In contrast to the previous
two studies, data analysis in the present study did not reveal
any correlation between PTH levels and BMD values both in
two sub-groups of CAPD and HD patients. Serum Ca+2 level was
higher (p=0.034) in HD patients (group A). However, QUI and
BUA (p=0.056 and p=0.012) were higher in CAPD patients (group
A) compared to other three groups (Table 3, Figure 5).
In a recent study [31], effects of cigarette-smoking on bone
mass were investigated in 75-year old women (n=1042) on a
population basis [Osteoporosis Prospective Risk Assessment
(OPRA)] study, by DEXA and ultrasound, and it was found that
smoking has a negative influence on bone mass independent
of differences in weight and physical activity. Bone mass
as assessed by ultrasound of the calcaneus was lower for SOS
(p<0.01), BUA (p<0.0001) and QUI (stiffness) (p<0.0001)
in smokers than in never-smokers. In the HD group, we found
BMD to be lower (0.42±0.11 vs. 0.49±0.09 g/cm2,
p=0.056) in smokers compared to non-smokers. There were also
differences in QUI and BUA of the calcaneus between smokers
and non-smokers. However, there were significant differences
in only SOS (1526±27 vs. 1548±19 g/cm2, p=0.016)
and avarage Z score (-1.48±0.59 vs. -0.82±0.58,
p=0.031). Bone mass as assessed by ultrasound was lower for
SOS (p=0.016), BUA (p=0.580) and QUI (p=0.056) in smokers
than in non-smokers (Table 4). In our study, increased OR
was found only for smoking and dialysis type (HD). The adjusted
OR and 95% confidence interval (95% CI) for osteoporosis was
4.96 (95% CI: 1.16-24.79) for smoking (independent of differences
in weight), and 2.81 (95% CI: 1.05-8.37) for dialysis type
(HD) (p=0.008 and p=0.024).
In conclusion, while we have failed to confirm
PTH-related bone disease in affecting QUS parameters in dialysis
patients, we have found that other factors, which are known
to be risk factors for osteoporosis, are also important. Smoking
has also a negative influence on QUS parameters especially
QUI and SOS. Chronic HD patients have reduced calcaneal BUA.
These findings suggest that there is an unfavorable effect
of smoking and dialysis type (HD) on bone mineralization.

REFERENCES
- Taal MW, Cassidy MJ, Pearson
D, Green D, Masud T. Usefulness of quantitative heel ultrasound
compared with dual-energy X-ray absorptiometry in determining
bone mineral density in chronic haemodialysis patients.
Nephrol Dial Transplant 1999; 14: 1917-21.
- Gram J, Hansen TB, Jensen PB, Christensen
JH, Ladefoged S, Pedersen FB. The effect of recombinant
human growth hormone treatment on bone and mineral metabolism
in haemodialysis patients. Nephrol Dial Transplant 1998;
13: 1529-34.
- Consensus development conference. Diagnosis,
prophylaxis and treatment of osteoporosis. Am J Med 1991;
90:107-10.
- Ensrud KE, Palermo L, Black DM, Cauley J,
Jergas M, Orwoll ES, et al; Hip and calcaneal bone loss
increase with advancing age: longitudinal results from the
study of osteoporotic fractures. J Bone Miner Res 1995;
10: 1778-87.
- Henry RR, Wiest-Kent TA, Scheaffer L, Kolterman
OG, Olefsky JM. Metabolic consequences of very-low-calorie
diet therapy in obese noninsulin-dependent diabetic and
nondiabetic subjects. Diabetes 1986; 35:155-64.
- Kirchengast S, Knogler W, Hauser G. Protective
effect of moderate overweight on bone density of the hip
joint in elderly and old Austrians. Anthropol Anz 2002;
60: 187-97.
- Hans D, Schott AM, Meunier PJ. Ultrasonic
assessment of bone: a review. Eur J Med 1993; 2: 157-63.
- Kaufman JJ, Einhorn TA. Perspectives Ultrasound
assessment of bone. J Bone Miner Res 1993;8:517-25.
- Langton CM, Palmer SB, Porter RW. The measurement
of broadband ultrasound attenuation in cancellous bone.
N Engl J Med 1984; 13: 89-91.
- Bauer DC, Gluer CC, Cauley JA, Vogt TM, Ensrud
KE, Genant HK, et al. Broadband ultrasound attenuation predicts
strongly and independently of densitometry in older women.
Archiv Int Med 1997; 157: 629-633.
- Hans D, Dargent-Molina P, Schott AM, Sebert
JL, Cormier C, Kotzki PO, et al. Ultrasonographic heel measurements
to predict hip fracture in elderly women: the EPIDOS prospective
study. Lancet 1996;348:511-4.
- Brown JP, Josse RG. 2002 clinical practice
guidelines for the diagnosis and management of osteoporosis
in Canada. Can Med Assoc J 2002; 167: 1S-34S.
- Knapp KM, Blake GM, Spector TD, Fogelman
I. Can the WHO definition of osteoporosis be applied to
multi-site axial transmission quantitative ultrasound? Osteoporos
Int 2004; 15 (5): 367-74.
- Hologic Incorporation. Sahara clinical bone
sonometer: clinical user's guide. Waltham: MA; 1997.
- Hagiwara S, Aratani H, Miki T, Nishizawa
Y, Okamura T, Koizumi Y, et al; Total body and regional
bone mineral content in haemodialysis patients. Ann Nucl
Med 1994; 8: 41-6.
- Pluijm SMF, Graafmans WC, Bouter LM, Lips
P. Ultrasound measurements for the prediction of osteoporotic
fractures in elderly people. Osteoporosis International
1999; 9: 550-6.
- Nowak Z, Tlustochowicz W, Wankowicz Z. [Bone
mineral density in patients with irreversible renal failure
treated with peritoneal dialysis] Pol Arch Med Wewn 2001;
106: 1035-40 [Article in Polish].
- Baszko-Blaszyk D, Grzegorzewska AE, Horst-Sikorska
W, Sowinski J. Bone mass in chronic renal insufficiency
patients treated with continuous ambulatory peritoneal dialysis.
Adv Perit Dial 2001; 17: 109-13.
- Taal MW, Masud T, Green D, Cassidy MJD. Risk
factors for reduced bone density in haemodialysis patients.
Nephrol Dial Transplant 1999; 14: 1922-28.
- Hutchison AJ, Whitehouse RW, Boulton HF,
Adams JE, Mawer EB, Freemont TJ, et al; Correlation of bone
histology with parathyroid hormone, vitamin D3, and radiology
in end-stage renal disease. Kidney Int 1993; 44: 1071-1077
- Lechleitner P, Krimbacher E, Genser N, Fridrich
L, zur Nedden D, Helweg G, et al; Bone mineral densitometry
in dialyzed patients: quantitative computed tomography versus
dual photon absorptiometry. Bone 1994; 15: 387-91.
- Gupta A, Kallenbach LR, Divine GW. Increased
risk of hip fractures in U.S. Medicare end-stage renal disease
patients. J Bone Miner Res 1997; 12 Suppl 1: S274
- Arici M, Erturk H, Altun B, Usalan C, Ulusoy
S, Erdem Y, et al; Bone mineral density in haemodialysis
patients: A comparative study of dual-energy X-ray absorptiometry
and quantitative ultrasound. Nephrol Dial Transplant 2000;
15: 1847-51.
- Foldes AJ, Arnon E, Popovtzer MM. Reduced
speed of sound in tibial bone of haemodialysed patients:
association with serum PTH level. Nephrol Dial Transplant
1996; 11: 1318-21.
- Brockstedt H, Christiansen P, Mosekilde L,
Melsen F. Reconstruction of cortical bone remodeling in
untreated primary hyperparathyroidism and following surgery.
Bone 1995; 16: 109-17.
- Sherrard DJ, Hercz G, Pei Y, Maloney NA,
Greenwood C, Manuel A, et al; The spectrum of bone disease
in end-stage renal failure-an evolving disorder. Kidney
Int 1993; 43: 436-42.
- Fletcher S, Jones RG, Rayner HC, Harnden
P, Hordon LD, Aaron JE, et al; Assessment of renal osteodystrophy
in dialysis patients: use of bone alkaline phosphatase,
bone mineral density and parathyroid ultrasound in comparison
with bone histology. Nephron 1997;75: 412-9.
- Peretz A, Penaloza A, Mesquita M, Dratwa
M, Verhas M, Martin P, et al; Quantitative ultrasound and
dual X-ray absorptiometry measurements of the calcaneus
in patients on maintenance hemodialysis. Bone 2000; 27:
287-92.
- Pecovnik Balon B, Hojs R, Zavratnik A, Kos
M. Bone mineral density in patients beginning hemodialysis
treatment. Am J Nephrol 2002; 22: 14-7.
- Pasadakis P, Thodis E, Mourvati E, Euthimiadou
A, Margaritis D, Manavis J, et al; Evaluation of bone mineral
density in CAPD patients with dual energy X-ray absorptiometry.
Adv Perit Dial 1996; 12: 245-9.
- Gerdhem P, Obrant KJ. Effects of Cigarette-Smoking
on Bone Mass as Assessed by Dual-Energy X-ray Absorptiometry
and Ultrasound. Osteoporos Int 2002; 13: 932-6.

TABLE 1. Demographic,
biochemical and QUS parameters of HD, CAPD and Control groups.
| |
Groups |
p |
| |
HDn=25 |
CAPDn=16 |
CONTROLn=32 |
Patients
(M/F)
Age
Dialysis Duration (month)
Height (cm)
Weight (kg)
BMI (kg/m2)
QUI (g/cm2)
BUA (dB/Mhz)
SOS (m/s)
T - score
Z - score
PTH (pg/mL)
ALP (IU/L)
Ca+2 (mg/Dl)
P (mg/dL)
Smoker
Menopausal Women
Underweight/Overweight
Ca+2 carbonate or acetate
Hydroxylated Vitamin D
RhuEPO
|
16/9
40.2±15.5
31.8±12.6
163±8
55±12
20.7±4.7
85±16
61±17
1537±25
-2.72±0.96
-1.12±0.66
376±291
170±114
8.5±1.6
5.7±1.5
12
6
9/3
25
15
20
|
10/6
36.0±9.9
42.8±12.8
168±8
61±12
21.8±4.3
93±17
74±14
1545±30
-1.01±0.73
-0.87±0.67
238±195
131±53
9.4±1.7
6.2±1.7
5
2
6/4
16
6
14
|
15/17
37.7±13.1
0
165±7
68±13
24.9±4.1
89±14
69±17
1540±19
-1.04±0.72
-0.81±0.69
46±19
79±24
9.0±1.0
4.5±0.6
9
6
0/15
0
0
0
|
=0.367
=0.494
=0.011*
=0.185
=0.001
=0.001
=0.208
=0.015
=0.597
=0.008
=0.189
<0.000
=0.001
=0.291
=0.003
=0.258
=0.262
=0.001
>0.05*
>0.05*
>0.05*
|
* HD and CAPD groups were compared.
TABLE 2. Demographic, biochemical
and QUS parameters of HD and CAPD subgroups according to BMI
levels.
| |
HEMODIALYSIS |
PERITONEAL DIALYSIS |
p |
| Group A(BMI
<18.5 kg/cm2)n=9 |
Group B(BMI
=18.5 kg/cm2)n=16 |
Group A(BMI
<18.5 kg/cm2)n=6 |
Group B(BMI
=18.5 kg/cm2)n=10 |
Age
Dialysis Duration (mo)
QUI (g/cm2)
BUA (dB/Mhz)
SOS (m/s)
T - score
Z - score
PTH (pg/mL)
ALP (IU/L)
Ca+2 (mg/dL)
P (mg/dL)
|
28.4±7.6
33.1±14.8
85±16
59±17
1541±25
-1.43±0.76
-1.26±0.78
405±359
171±91
7.9±1.5
6.0±1.2
|
46.9±15.0
31.1±11.6
84±17
62±18
1536±25
-1.51±1.08
-1.06±0.61
362±268
168±132
9.0±1.6
5.6±1.7
|
29.3±5.7
40.7±12.9
98±25
73±20
1558±43
-1.13±1.07
-1.35±0.98
221±111
109±5
8.9±1.7
6.3±2.1
|
40.0±9.9
44.0±13.3
90±10
74±10
1538±16
-0.97±0.49
-0.68±0.42
250±248
144±65
9.6±2.2
6.0±1.1
|
=0.002
=0.004
=0.046
=0.003
=0.171
=0.110
=0.086
=0.494
=0.676
=0.066
=0.819 |
TABLE 3.
Demographic, biochemical and QUS parameters of HD and CAPD
subgroups according to PTH level
| |
HEMODIALYSIS |
PERITONEAL DIALYSIS |
p |
| Group A(PTH
<200 pg/mL)n=9 |
Group B(PTH
=200 pg/mL)n=16 |
Group A(PTH
<200 pg/mL)n=9 |
Group B(PTH
=200 pg/mL)n=7 |
Age
Dialysis Duration (mo)
BMI (kg/m2)
QUI (g/cm2)
BUA (dB/Mhz)
SOS (m/s)
T - score
Z - score
ALP (IU/L)
Ca+2 (mg/dL)
P (mg/dL)
|
Age
Dialysis Duration (mo)
BMI (kg/m2)
QUI (g/cm2)
BUA (dB/Mhz)
SOS (m/s)
T - score
Z - score
ALP (IU/L)
Ca+2 (mg/dL)
P (mg/dL)
|
45.0±15.1
32.0±13.7
21.9±13.7
90±18
66±18
1546±27
-1.46±1.12
-1.04±0.50
162±109
9.3±1.7
5.5±1.7
|
42.8±8.9
36.0±15.7
22.8±4.6
98±10
81±9
1550±18
-0.65±0.44
-0.45±0.16
109±21
10.5±1.6
7.0±1.8
|
42.8±8.9
36.0±15.7
22.8±4.6
98±10
81±9
1550±18
-0.65±0.44
-0.45±0.16
109±21
10.5±1.6
7.0±1.8
|
=0.092
=0.021
=0.371
=0.054
=0.012
=0.169
=0.037
=0.008
=0.239
=0.034
=0.150 |
TABLE 4. Demographic, biochemical
and QUS parameters of non-smokers and smokers in HD patients.
| |
HEMODIALYSIS
PATIENTS |
|
Age
Dialysis Duration (month)
BMI (kg/m2)
QUI (g/cm2)
BUA (dB/Mhz)
SOS (m/s)
T - score
Z - score
PTH (pg/mL)
ALP (IU/L)
Ca+2 (mg/dL)
P (mg/dL)
|
40.0±13.3
33.6±14.8
21.7±5.8
90±14
63±18
1548±19
-1.29±1.12
-0.82±0.58
467±282
178±104
8.1±1.5
5.7±1.5
|
43.2±17.2
31.5±11.1
20.4±3.4
79±18
59±18
1526±27
-1.77±0.83
-1.48±0.59
308±289
145±130
9.5±0.8
5.5±1.4
|
=0.644
=0.967
=0.853
=0.056
=0.580
=0.016
=0.064
=0.031
=0.137
=0.155
=0.020
=0.819 |
FIGURE 1
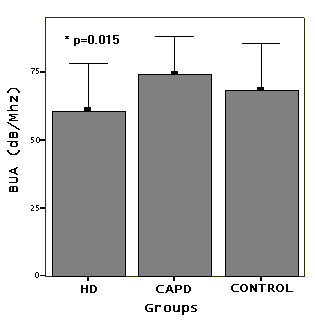
FIGURE 2
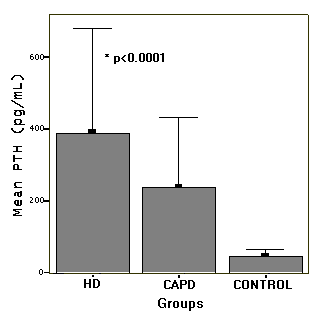
FIGURE 3
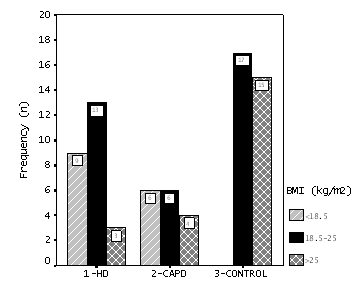
FIGURE 4
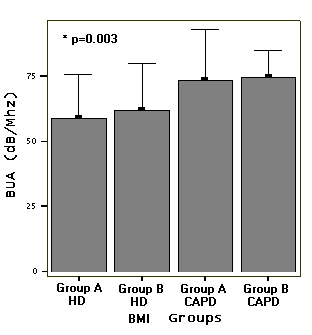
FIGURE 5
|


