| WHY
DO
WE
PERFORM
SYSTEMATIC
REVIEWS? |
Systematic
reviews
and
meta-analyses
use
systematic
method
of
searching
and
locating
studies
to
minimize
bias.
This
is
achieved
by
combining
high
quality
studies
by
searching
electronic
databases
preferably
with
no
restriction
to
language
and
including
both
published
and
unpublished
articles.
Combining
studies
together
increases
the
sample
size
and
minimizes
the
effect
of
random
error
in
the
overall
appreciation
of
evidence.
In
addition,
systematic
reviews
also
can
save
the
costs
of
conducting
additional
randomized
controlled
trials
(RCT)
to
answer
the
same
research
question.
Six
steps
for
conducting
systematic
review
1.
A
well
formulated
question
2.
Finding
studies
3.
Selecting
studies
4.
Data
extraction
5.
Appraising
studies
6.
Combining
results
Step
1:
A
well
formulated
question
A
well
formulated
question
is
the
first
step
in
any
research.
Well-formulated
questions
will
guide
many
aspects
of
the
review
process,
including
determining
eligibility
criteria,
searching
for
studies,
collecting
data
from
included
studies,
and
presenting
findings.
Converting
the
question
into
PICOT
format
is
essential
to
define
each
component
well.
PICO
was
discussed
in
a
previous
chapter
and
T
stands
for
type
of
study
and
time.
PICOT
defines
well
the
Population,
the
Intervention,
the
Comparison,
the
Outcome,
and
the
Type
of
study,
its
duration
and
time
it
was
conducted.
The
question
may
be
broad
or
narrow.
A
broad
question
for
example
is:
antibiotics
for
treatment
of
UTI;
while
a
narrow
question
is
like:
third
generation
cephalosporin
for
treatment
of
childhood
cystitis.
Review
authors
will
decide
about
the
scope
of
their
review,
bearing
in
mind
that
a
too
narrow
question
may
affect
the
generalizability
of
the
results,
while
a
too
broad
question,
may
affect
the
manageability
of
the
project
(i.e.,
authors
may
not
be
able
to
do
the
review
due
to
resources
consumption).
Step
2:
Finding
studies
A
comprehensive
search
strategy
that
includes
most
relevant
electronic
databases
(e.g.,
Pubmed,
Embase
and
Cochrane
library)
in
addition
to
non-electronic
resources
is
necessary
to
retrieve
all
relevant
studies.
The
choice
of
keywords
(based
on
PICOT)
is
critical
for
the
search.
A
good
search
is
one
with
no
language
restriction,
no
date
restriction,
up-to-date,
and
includes
both
published
and
unpublished
literature.
The
bottom
line
is
not
to
miss
any
relevant
study
until
the
date
of
manuscript
submission.
Following
are
the
resources
to
be
searched:
1.
Electronic
databases
2.
Hand
or
manual
search
3.
Full
text
journals
and
table
of
contents
(TOC)
4.
Conference
abstracts
and
proceedings
5.
Reference
lists
6.
Unpublished
studies
7.
Clinical
trial
registries
8.
Grey
literature
9.
Pharmaceutical
industry
trial
registers
1.
Electronic
databases:
The
aim
of
thorough
search
is
to
locate,
as
many
as
possible,
relevant
studies
and
not
to
miss
an
important
study.
A
minimum
of
three
essential
databases
must
be
searched,
which
are:
The
Cochrane
Central
Register
of
Controlled
Trials
(CENTRAL),
MEDLINE
and
EMBASE.
Both
free-text
and
subject
headings
should
be
used
(e.g.,
Medical
Subject
Headings
(MeSH).
Searching
MEDLINE
alone
is
not
sufficient
to
detect
all
RCT.
2.
Hand
search:
Hand
searching
is
complementing
electronic
database
search
because
not
all
journals
are
indexed
in
electronic
databases.
3.
Full
text
journal
search
and
table
of
contents:
Many
journals
have
an
electronic
full
text
either
free
of
charge
or
with
subscription.
Examples
of
free
of
charge
websites:
•
BioMed
Central:
www.biomedcentral.com/browse/journals/
•
Public
Library
of
Science
(PLoS):
www.plos.org/journals/
•
PubMed
Central
(PMC):
www.pubmedcentral.nih.gov/
Web
sites
listing
journals
offering
free
full-text
access
includes:
•
Free
Medical
Journals:
freemedicaljournals.com/
•
HighWire
Press:
highwire.stanford.edu/lists/freeart.dtl
There
are
also
a
number
of
international
initiatives
to
provide
free
or
low-cost
online
access
to
full-text
journals
(and
databases)
over
the
internet,
including:
•
The
Health
InterNetwork
Access
to
Research
Initiative
(HINARI)
www.who.int/hinari/en/
•
The
International
Network
for
the
Availability
of
Scientific
Publications
(INASP)
www.inasp.info/file/68/about-inasp.html,
and
•
Electronic
Information
for
Libraries
(EIFL)
www.eifl.net/cps/sections/about
Table
of
Contents
(TOC):
Several
organizations
and
journals,
offer
Table
of
Contents
(TOC)
services
free
of
charge,
normally
through
e-mail
alerts
or
RSS
feeds.
Examples
of
organizations
offering
TOC
services
•
British
Library
Direct
(free):
direct.bl.uk/bld/Home.do
•
British
Library
Direct
Plus
(subscription):
www.bl.uk/reshelp/atyourdesk/docsupply/productsservices/bldplus/
•
British
Library
Inside
(to
be
replaced
by
British
Library
Direct
Plus)
(subscription):
www.bl.uk/inside
•
Current
Contents
Connect
(subscription):
scientific.thomson.com/products/ccc/
•
Scientific
Electronic
Library
Online
(SciELO)
-
Brazil
(free):
www.scielo.br/
4.
Conference
abstracts
and
proceedings:
More
than
50%
of
clinical
trials
presented
in
conferences
failed
to
be
published.
Those
that
are
eventually
published
in
full
have
shown
to
be
systematically
different
from
those
that
are
never
published
in
full
(Scherer,
2007).
Conference
abstracts
are
identified
by
hand
search
and
proceedings
in
CD
Rom.
A
number
of
websites
publish
these
abstracts:
•
The
BIOSIS
databases
(http://www.biosis.org/)
•
The
American
Society
of
Clinical
Oncology
(ASCO):www.asco.org/ASCO/Meetings
•
Biological
Abstracts/RRM
(Reports,
Reviews,
Meetings):
scientific.thomson.com/products/barrm/
•
British
Library
Inside
(to
be
replaced
by
British
Library
Direct
Plus):
www.bl.uk/inside
•
British
Library
Direct
Plus:
www.bl.uk/reshelp/atyourdesk/docsupply/productsservices/bldplus
•
ISI
Proceedings:
scientific.thomson.com/products/proceedings/
5.
Reference
list:
Reference
lists
of
published
systematic
reviews,
studies,
or
guidelines
are
convenient
resources
of
studies.
Useful
resources
are
the
Cochrane
library,
Trip
database,
NICE
guidelines,
SIGN
guidelines
and
guideline.gov.
6.
Unpublished
studies:
Not
all
completed
studies
are
published.
Finding
and
including
unpublished
studies
minimizes
bias.
Publication
bias
occurs
when
the
decision
to
publish
is
based
on
study
results
and
not
how
the
study
was
conducted
(the
method).
Are
Published
studies
enough?
Studies
with
positive
results
are
submitted
and
get
published
2.5
times
more
than
negative
ones.
Negative
studies
are
less
likely
to
be
published.(11)
Publication
Bias
Studies
with
positive
results
are
more
likely
to
be
published,
published
rapidly,
in
English,
have
more
than
one
source
(duplication),
and
are
cited
more
than
negative
studies.
All
trials
should
be
registered
as
early
as
possible
even
at
protocol
stage
for
example:
•
Clinical
trial
registry:
www.clinicaltrial.gov
•
The
National
Clinical
Trials
Registry:
Cancer
trials
•
National
Institutes
of
Health
Inventory
of
Clinical
Trials
and
Studies
•
International
Registry
of
Perinatal
Trials
•
Meta-registry
of
Trial
Registries:
www.controlled-trials.com
Publication
bias
may
be
presented
visually
by
plotting
and
reviewing
the
funnel
plot,
which
is
a
graph
with
(Y)
axis
representing
the
sample
size,
starting
from
the
bottom
with
small
sample
size
studies
and
ends
at
the
top
with
large
studies.
The
(X)
axis
represents
effect
measures
of
individual
studies.
The
line
at
the
middle
is
the
line
of
point
estimate
(not
the
line
of
no
effect).
Usually
effect
measures
of
studies
will
be
distributed
equally
on
both
sides
of
the
point
estimate
line
with
effect
measures
of
small
sized
studies
that
are
more
in
number
and
situated
at
the
bottom
of
the
curve.
If
publication
bias
is
not
a
major
issue,
then
an
inverted
funnel
shaped,
symmetrical
curve
is
usually
produced.
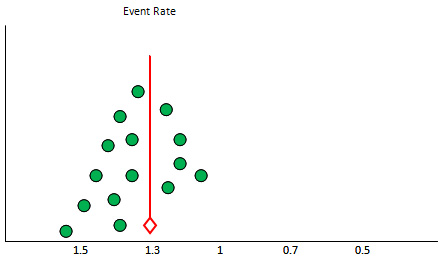
In
case
of
publication
bias,
there
is
asymmetry
of
the
funnel
plot
due
to
unpublished
small
and
negative
studies.
Figure
1:
Forest
plot
with
dotted
line
of
pooled
estimate
and
studies
distributed
equally
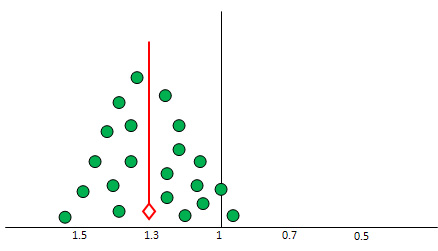
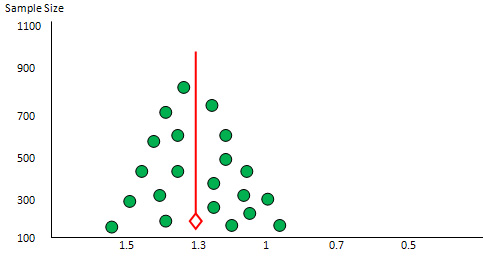
Figure
2:
Funnel
plot
Y=100-1000,
x=
1
no
effect
line,
1.2
1.1.6
the
other
side
0.8,
0.6,
0.4
with
symmetrical
distribution
of
studies
Figure
3:
Funnel
plot
with
asymmetry
due
to
missing
studies
7.
Clinical
trials
registries
were
established
to
prevent
reporting
bias
including
publication
bias
(i.e.,
ClinicalTrials.gov
register:
clinicaltrials.gov/)
8.
Grey
literature:
Hirtle
has
defined
Grey
Literature
as:
Unpublished
printed
reports,
but
circulated
papers,
unpublished
proceedings
of
conferences,
printed
programs
from
conferences,
and
the
other
non-unique
material
which
seems
to
constitute
the
bulk
of
our
modern
manuscript
collections
(Hirtle,
1991).
Conference
abstracts
and
other
grey
literature
have
been
shown
to
be
sources
of
approximately
10%
of
the
studies
referenced
in
Cochrane
reviews
(Mallett,
2002).
In
a
recently
updated
Cochrane
methodology
review,
all
five
studies
reviewed
showed
that
published
trials
presented
an
overall
greater
treatment
effect
than
grey
literature
trials
(Hopewell
2007b).
Grey
literature
may
be
found
in
the
internet
from
the
following
resources:
•
ALA
Internet
Resources:
Gray
Literature
•
GreyNet:
The
Grey
Literature
Network
Service
•
Science.gov
is
a
gateway
to
over
50
million
pages
of
authoritative
selected
science
information
provided
by
U.S.
government
agencies,
including
research
and
development
results.
•
http://www.scienceaccelerator.gov/
Science
Accelerator
searches
science,
including
R&D
results,
project
descriptions,
accomplishments,
and
more,
via
resources
made
available
by
the
Office
of
Scientific
and
Technical
Information
(OSTI),
U.S.
Department
of
Energy.
•
The
GrayLIT
network:
A
science
portal
of
technical
reports.
From
the
Office
of
Scientific
&
Technical
Information
at
the
United
States
Department
of
Energy.
•
Grey
Literature
Library
for
UK
Archaeology.
•
The
International
Journal
on
Grey
Literature
published
one
volume
in
2000.
The
content
may
be
limited
to
subscribers.
•
CiteSeerX
indexes
some
of
the
gray
literature
such
as
technical
reports
in
computer
and
information
science.
•
Open
Grey
Repository,
formerly
OpenSIGLE.
9.
Pharmaceutical
industry
trial
registers:
Most
pharmaceutical
industries
keep
registry
for
all
clinical
trials
funded
by
them.
Step
3:
Study
selection
Researchers
should
apply
the
pre-specified
inclusion
and
exclusion
criteria
in
order
to
select
the
relevant
studies.
At
least
two
reviewers
are
doing
the
selection
of
relevant
studies
independently.
A
disagreement
about
whether
certain
studies
should
be
included
is
resolved
by
discussion.
The
following
steps
are
useful
to
do
so:
1.
Merge
search
results
using
reference
management
software
(e.g.,
endnote)
and
remove
duplicate
records
of
the
same
report.
2.
Examine
titles
and
abstracts
to
remove
obviously
irrelevant
reports
(i.e.,
authors
should
generally
be
over-inclusive
at
this
stage).
3.
Retrieve
full
text
of
the
potentially
relevant
reports.
4.
Examine
full-text
reports
for
compliance
of
studies
with
eligibility
criteria.
5.
Correspond
with
investigators,
where
appropriate,
to
clarify
study
eligibility
(it
may
be
appropriate
to
request
further
information,
such
as
missing
results,
at
the
same
time).
6.
Make
final
decisions
on
study
inclusion
and
proceed
to
data
collection.
Step
4:
Data
extraction
The
systematic
review
process
of
obtaining
necessary
information
from
retrieved
articles
in
specific
forms
is
called
data
extraction.
The
nature
of
information
extracted
should
be
tailored
to
the
review
question.
Details
of
the
data
extraction
process
and
the
data
extraction
form
should
be
included
in
the
review
protocol.
The
latter
should
be
piloted,
refined,
and
linked
to
the
future
assessment
of
the
study
quality
prior
to
the
start
of
the
systematic
review.
The
use
of
electronic
data
extraction
forms
can
facilitate
obtaining
relevant
information
from
an
article
in
a
standardized
way
and
can
reduce
the
time
for
data
analysis
and
production
of
tables.
Piloting
of
data
extraction:
Ideally,
data
extraction
forms
should
be
piloted
on
a
sample
of
included
articles
to
ensure
that
the
process
will
be
conducted
in
a
comprehensive
and
standardized
way.
The
process
of
data
extraction
should
be
assessed
for
both
accuracy
and
consistency.
The
latter
is
usually
evaluated
by
quantifying
the
inter-rater
agreement
beyond
chance
(Kappa)
and
is
of
particular
importance
in
reviews
where
coding
data
will
be
employed.
Process
of
data
extraction:
The
primary
aim
of
the
data
extraction
process
is
to
avoid
human
errors
and
subjective
decisions,
and
hence
the
form
should
be
valid
and
reliable
as
much
as
possible.
In
an
ideal
data
extraction
process,
two
researchers
should
independently
perform
the
task;
while
a
third
researcher
should
be
checking
the
forms
for
accuracy,
completeness
and
consistency.
The
number
and
reasons
of
disagreements
among
data
extractors
should
be
reported
and
resolved
by
consensus
among
researchers
first,
or
by
arbitration
in
case
a
consensus
could
not
be
reached.
If
time
and
resources
constraints
limit
the
number
of
researchers
involved
in
data
extraction,
the
minimum
acceptable
process
would
be
that
one
researcher
should
extract
the
data
with
a
second
researcher
checking
for
accuracy
and
completeness.
Blinding
researchers
to
the
journal
and
author
details
can
be
time-consuming
but
has
been
recommended
to
avoid
observer
bias
in
terms
of
selecting
and
extracting
evidence
from
individual
studies.
However
other
investigators
have
reported
a
limited
benefit
of
blinding
in
improving
the
accuracy
of
results.
Nature
of
extracted
data:
The
type
of
data
extracted
in
the
predefined
extraction
forms
depends
on
the
research
question
posed
and
the
types
of
study
designs
included.
The
box
below
includes
data
that
are
most
commonly
extracted
in
systematic
reviews
for
clinical
trial.
Step
5:
Assess
Risk
of
Bias
(ROB)
A
bias
is
defined
as
a
systematic
error,
or
deviation
from
the
truth,
in
results
or
inferences.
Biases
are
not
the
same.
Some
have
a
minor
effect
on
the
validity
of
any
study;
while
some
can
pose
a
substantial
effect.
Biases
can
lead
to
underestimation
or
overestimation
of
the
true
intervention
effect.
To
what
extent
biases
have
affected
the
results
of
a
study
is
difficult
to
answer.
Studies
included
in
systematic
reviews
should
be
classified
into
studies
with
low
risk
of
bias,
unclear,
or
high
risk
of
bias.
In
1995,
Moher
and
colleagues
identified
25
scales
and
9
checklists
that
had
been
used
to
assess
the
validity
or
'quality'
of
randomized
trials
(Moher,
1995
and
1996).(14,15)
One
commonly-used
scale
was
developed
by
Jadad
and
colleagues
for
randomized
trials
in
pain
research
(Jadad,
1996).(14)
Cochrane
collaboration
discourage
the
use
of
this
scale
as
it
does
not
cover
one
of
the
most
important
potential
biases
in
randomized
trials,
namely
allocation
concealment.
The
Cochrane
Collaboration's
recommended
tool
for
assessing
risk
of
bias
is
neither
a
scale
nor
a
checklist.
It
is
a
domain-based
evaluation,
in
which
critical
assessments
are
made
separately
for
different
domains.
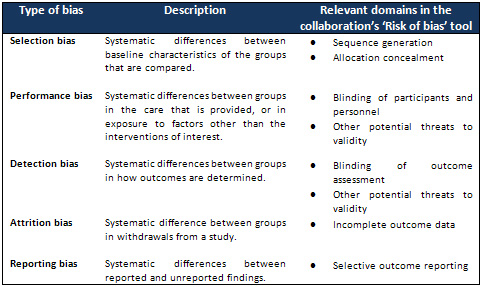
There
are
5
possible
sources
of
biases
in
individual
studies:
1.
Selection
bias:
What
differentiates
RCT
from
other
types
of
studies
is
that
it
starts
with
balanced
groups,
i.e.,
the
baseline
characteristics
of
the
groups
is
similar.
This
balance
is
due
to
two
processes:
(1)
generation
of
randomization
list
by
computer
then
the
(2)
distribution
of
subjects
to
the
intervention
and
control
groups
by
secret
methods
(concealment);
by
using
serially
numbered,
opaque
and
sealed
envelopes;
or,
by
remote
telephone
call.
Failure
to
do
so
can
affect
the
validity
of
the
study
and
lead
to
selection
bias.
2.
Performance
bias:
The
intervention
and
control
groups
must
maintain
balance
by
blinding
which
should
be
masked
until
the
end
of
the
study.
Everyone
who
is
dealing
with
a
patient
or
his
data
must
be
blind
to
who
is
taking
what.
The
care
provided
to
both
groups
must
be
the
same.
Failure
to
do
so,
can
lead
to
what
is
so
called
performance
bias.
3.
Detection
bias:
If
outcome
assessors
know
who
is
taking
what,
they
may
deviate
from
the
truth,
and
create
bias
in
the
evaluation
of
outcomes.
Outcome
assessors
must
be
blind
especially
when
the
outcome
is
subjective
(e.g.,
assessment
of
pain).
Failure
to
do
so
can
lead
to
"detection"
bias.
4.
Attrition
bias:
Attrition
refers
to
any
situation
in
which
the
outcome
data
of
a
particular
subject
is
not
complete
or
corrupted.
It
may
be
due
to
drop-out,
cross-over,
or
the
outcome
data
is
not
complete.
When
any
of
these
situations
happen,
an
attrition
bias
should
be
suspected.
5.
Reporting
bias:
There
are
many
types
of
reporting
biases.
Publication
bias
was
described
before.
Within-study
publication
bias
describes
a
condition
when
positive
findings
are
reported
more
than
negative
ones.
Table
2:
Cochrane
Criteria
Assessment
of
ROB
Step
6:
Meta-analysis
Meta-analysis
is
the
statistical
combination
of
results
across
the
combined
studies.
There
are
many
statistical
packages
to
do
so,
mainly
RevMan
(The
Review
Manager),
produced
by
Cochrane
collaboration.
It
is
free
of
charge
for
Cochrane
reviewers
or
anyone
doing
systematic
review.
Another
one
is
the
comprehensive
meta-analysis
software
(CMA);
which
is
a
commercial
software
that
needs
to
be
purchased.
Another
software
for
diagnostic
meta-analysis
is
the
Metadisc
software,
which
is
also
free
of
charge.
The
principle
concept
of
pooling
results
together
in
meta-analysis
is
weighted
average
principle.
Example:
In
class
A,
the
average
score
of
the
20
students
is
50,
while
in
class
B
the
average
score
for
the
10
students
is
60.
What
is
the
average
of
the
2
classes?
(50
X
20)
+
(60
X
10)/
(20
+
10)
=
48
(not
55)
To
interpret
the
meta-analysis,
one
needs
to
answer
4
questions:
1.
What
is
the
direction
of
effect?
2.
What
is
the
size
of
effect?
3.
Is
the
effect
consistent
across
studies?
4.
What
is
the
strength
of
evidence
for
the
effect?
Q1.
What
is
the
direction
of
effect?
Is
the
pooled
effect
(point
of
estimate)
at
the
site
of
control
(favors
control);
or
at
the
site
of
intervention
(favors
intervention);
or
crosses
the
no
effect
line
(no
difference
of
the
effect
between
the
intervention
and
the
control).
The
line
of
no
effect
is
(1)
for
dichotomous
data,
or
(0)
for
continuous
data.
Q2.
What
is
the
size
of
effect?
The
effect
measure
may
be
a
relative
value
(RR,
OR
or
HR)
or
absolute
mean
difference
(MD)
or
standardized
mean
difference
(SMD).
The
effect
is
presented
as
the
effect
measure
(size)
and
the
confidence
interval
(CI)
or
P
value.
Q3.
Is
the
effect
consistent
across
studies?
Inconsistency
or
heterogeneity
across
studies
is
the
amount
of
variation
of
the
results
across
studies.
(This
will
be
discussed
later
under
heterogeneity.)
Q4.
What
is
the
strength
of
evidence
for
the
effect?
This
needs
judgment
in
addition
to
the
effect
measure.
It
depends
on
the
study
design
and
risk
of
bias.
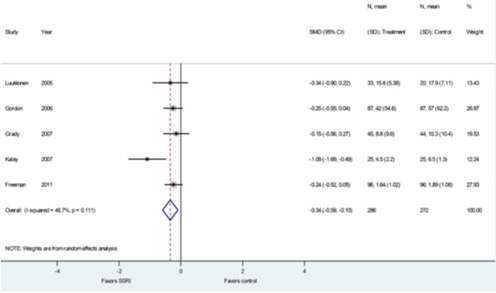
Figure
4:
SSRI
for
hot
flashes
meta-analysis,
improvement
in
standardized
hot
flashes
Heterogeneity
(Inconsistency)
1.
What
is
heterogeneity?
Variation
of
results
across
studies
that
may
be
due
to
random
effect
(no
statistical
significance)
or
due
to
heterogeneity
(statistical
significance).
It
may
be
due
to
diversity
in
PICO
elements,
differences
in
population,
intervention
or
outcome
measures
(called
clinical
heterogeneity);
or
may
be
due
to
bias,
e.g.,
variation
in
study
design,
conduct
or
attrition
between
individual
studies
(called
methodological
heterogeneity).
2.
Identifying
and
measuring
heterogeneity
There
are
3
methods
to
identify
heterogeneity:
a.
Eye
ball
or
visual
overlap:
The
extent
of
overlap
of
the
CI
in
the
included
studies
determine
its
consistency.
Draw
an
imaginary
line
from
the
pooled
effect
result.
If
there
is
one
study
or
more
that
are
not
crossed
by
this
line,
it
means
that
there
is
heterogeneity.
b.
P
value:
The
chi
square
test
of
heterogeneity,
when
it
is
less
than
or
equal
to
0.05
it
indicates
presence
of
heterogeneity.
c.
I2
test:
The
I2
test
is
a
modified
chi
square
test,
but
it
is
a
quantitative
test,
that
represents
the
percentage
of
heterogeneity.
It
is
the
proportion
of
total
variability
explained
by
heterogeneity.
How
much
is
too
much
heterogeneity?
Low
heterogeneity,
when
I2
is
25%,
moderate
when
I2
is
50%
and
high
when
I2
is
75%.
3.
Strategies
for
addressing
heterogeneity:
How
to
deal
with
heterogeneity
a.
Recheck
the
data
of
individual
studies.
b.
Do
not
do
meta-analysis
in
case
of
considerable
heterogeneity,
especially
when
the
result
is
in
favor
of
intervention.
c.
Do
subgroup
analysis:
it
is
the
splitting
of
all
participants'
data
into
subgroups,
based
on
any
of
the
PICOT
elements.
Subgroup
analysis
must
be
pre-specified,
because
ad-hoc
subgroup
analysis
of
multiple
outcomes
may
be
misleading
due
to
false
positive
and
false
negative
results.
d.
Ignore
heterogeneity:
Fixed
effect-model
(FEM)
ignores
heterogeneity.
Fixed
Effect
Model:
In
non-heterogeneous
studies,
there
is
one
true
treatment
effect.
Results
are
combined
with
the
studies
weighted
according
to
the
inverse
of
within-study
variance.
The
statistical
tests
used
are:
-
Mantel-Haenszel
method
for
relative
risk
(RR)
-
Peto's
method
for
odds
ratio
(OR)
Assumptions:
1.
Only
a
single
true
value
underlies
all
the
study
results;
2.
If
all
studies
were
infinitely
large,
they
would
yield
identical
estimate
of
the
effect;
and
3.
Each
study
estimates
a
difference
underlying
true
effect
and
the
distribution
of
these
effects
follows
a
normal
curve.
The
combined
effect
size
is
given
by
a
weighted
average
of
the
effect
from
each
individual
study
and
the
weight
for
each
study
is
the
inverse
of
its
variance.
e.
Perform
Random-effect
model
(REM).
Random
Effect
Model:
While
in
heterogeneous
studies,
there
are
multiple
true
treatment
effects.
Results
are
combined
with
the
study
weighted
according
to
the
inverse
of
the
sum
of
within-study
variance
and
among-study
variance,
the
statistical
test
used
is
DerSimonian
and
Laird
method.
Assumptions:
1.
Individual
studies
are
estimating
different
treatment
effects;
2.
The
treatment
of
different
studies
has
a
distribution
with
some
central
value
and
some
degree
of
variability.
The
excess
variation
should
be
taken
into
consideration
in
computing
the
combined
estimate.
The
procedures
to
obtain
a
combined
estimate
is
the
same
as
a
fixed-effects
model,
i.e.,
weighted
average,
which
is
the
inverse
variance
in
FEM
while
in
REM
is
the
inverse
"variance
plus
the
excess
variation."
e.
Do
Sensitivity
analysis:
Heterogeneity
may
be
due
to
outliers
that
are
totally
different
than
the
rest
of
the
studies.
It
is
not
logical
to
exclude
them,
but
in
a
few
occasions,
if
the
outlier
is
blamed
as
the
cause
of
the
variability,
it
may
be
excluded.
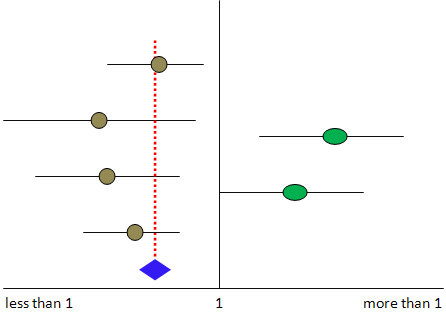
Figure
5-A:
Hypothetical
forest
plot
that
includes
4
studies
favoring
one
intervention
while
1
study
(outlier)
favors
another
intervention;
this
study
may
be
the
cause
of
heterogeneity.
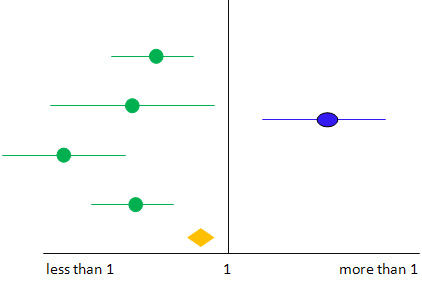
Figure
5-B:
In
case
the
outlier
study
is
removed
and
the
pooled
result
is
significantly
changed
(the
darker
diamond
shape),
then
one
can't
remove
it
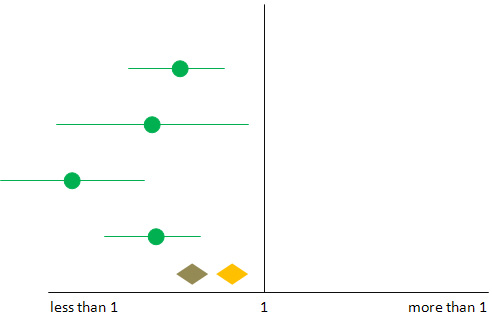
Figure
5-C:
However,
if
the
result
doesn't
change
significantly,
then
one
may
remove
the
outlier
safely
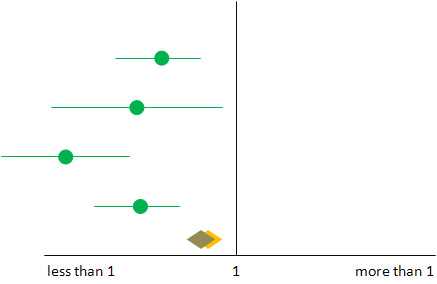
If
the
result
after
excluding
the
study
is
within
the
CI
of
the
result
before
exclusion,
then
the
study
could
be
excluded
without
affecting
the
result.
But
if
the
result
after
exclusion
is
changed,
i.e.,
not
included
within
CI
of
the
result
before
exclusion,
in
this
case
you
cannot
exclude
it.
1.
Lago
RM,
Singh
PP,
Nesto
RW.
Congestive
heart
failure
and
cardiovascular
death
in
patients
with
prediabetes
and
type
2
diabetes
given
thiazolidinediones:
a
meta-analysis
of
randomised
clinical
trials.
Lancet.
2007;370(9593):1129-36.
Epub
2007/10/02.
2.
Singh
S,
Loke
YK,
Furberg
CD.
Long-term
risk
of
cardiovascular
events
with
rosiglitazone:
a
meta-analysis.
JAMA
:
the
journal
of
the
American
Medical
Association.
2007;298(10):1189-95.
Epub
2007/09/13.
3.
Richter
B,
Bandeira-Echtler
E,
Bergerhoff
K,
Clar
C,
Ebrahim
SH.
Rosiglitazone
for
type
2
diabetes
mellitus.
The
Cochrane
database
of
systematic
reviews.
2007(3):CD006063.
Epub
2007/07/20.
4.
Antman
EM
LJ,
Kupelnick
B,
Mosteller
F,
Chalmers
TC.
.
A
comparison
of
results
of
meta-analyses
of
randomized
control
trials
and
recommendations
of
clinical
experts:
Treatments
for
myocardial
infarction.
JAMA
:
the
journal
of
the
American
Medical
Association.
1992;268:240-8.
5.
Oxman
AD
GG.
The
science
of
reviewing
research.
Annals
of
the
New
York
Academy
of
Sciences.
1993;703:125-33.
6.
GV
G.
Primary,
secondary
and
meta-analysis
of
research.
Educational
Researcher
1976;5:3-8.
7.
GB
J.
Methods
for
integrative
reviews.
Review
of
Educational
Research.
1980;50:438-60.
8.
HM
C.
The
problem
formulation
stage.
In:
Cooper
HM
(editors).
Integrating
Research:
a
Guide
for
Literature
Reviews.
Newbury
Park
(CA):
Sage
Publications.
1984.
9.
LV.
H.
Statistical
considerations.
In:
Cooper
H,
Hedges
LV
(editors).
The
Handbook
of
Research
Synthesis.
New
York
(NY):
Russell
Sage
Foundation,
.
1994.
10.
Jadad
AR,
Moore
RA,
Carroll
D,
Jenkinson
C,
Reynolds
DJ,
Gavaghan
DJ,
et
al.
Assessing
the
quality
of
reports
of
randomized
clinical
trials:
is
blinding
necessary?
Controlled
clinical
trials.
1996;17(1):1-12.
Epub
1996/02/01.
11.
Sacks
HS
BJ,
Reitman
D,
Acona-Berk
VA,
Chalmers
TC.
Meta-analysis
of
randomized
controlled
trials.
The
New
England
journal
of
medicine.
1987;316:450-5.
12.
Berlin
JA.
Does
blinding
of
readers
affect
the
results
of
meta-analyses?
University
of
Pennsylvania
Meta-analysis
Blinding
Study
Group.
Lancet.
1997;350(9072):185-6.
Epub
1997/07/19.
13.
Shams
T,
Firwana
B,
Habib
F,
Alshahrani
A,
Alnouh
B,
Murad
MH,
et
al.
SSRIs
for
Hot
Flashes:
A
Systematic
Review
and
Meta-Analysis
of
Randomized
Trials.
Journal
of
general
internal
medicine.
2013.
Epub
2013/07/28.
14.
Moher
D,
Jadad
AR,
Nichol
G,
Penman
M,
Tugwell
P,
Walsh
S.
Assessing
the
quality
of
randomized
controlled
trials:
An
annotated
bibliography
of
scales
and
checklists.
Controlled
Clinical
Trials
1995;
16:
62-73.
15.
Moher
D,
Jadad
AR,
Tugwell
P.
Assessing
the
quality
of
randomized
controlled
trials:
Current
issues
and
future
directions.
International
Journal
of
Technology
Assessment
in
Health
Care
1996;
12:
195-208.