This
study
is
a
comparative
and
cross-sectional
analytical
study,
in
which
40
benzene
exposed
workers
are
compared
to
40
healthy
subjects
with
no
exposure
to
benzene
as
the
control
group
with
the
same
sex
and
age
26-40).
The
number
of
people
working
in
benzene
refining
and
biochemical
energy
was
about
200
people
who
were
randomly
assigned
to
one
day
of
the
week
and
a
special
shift
based
on
the
willingness
and
satisfaction
of
the
person.
The
number
of
people
was
80,
40
people
selected
based
on
entry
criteria:
lack
of
exposure
to
metals
such
as
plumbum
and
zinc,
lack
of
alcohol
consumption,
supplemental
antioxidants
and
psychotropic
drugs,
lack
of
chronic
disease
and
mental
illness,
lack
of
radiation
therapy
background,
surgery
and
anesthesia
over
the
past
year,
work
experience,
and
ability
to
answer
questions.
30
people
who
did
not
have
entry
criteria
were
excluded
from
the
study.
It
should
be
noted
that
all
80
people
filled
out
clinical
symptoms
and
inclusion
criteria
questionnaires,
and
an
expert
interviewed
all
of
them.
Then,
40
cases
were
examined
for
blood
samples
at
8:30
am
in
the
morning
and
immediately
transferred
to
the
hospital.
Then,
according
to
age,
sex,
entry
criteria,
and
place
of
residence,
40
healthy
people
from
the
sales
office
(office
jobs)
50
kilometers
away
from
the
factory,
were
matched
to
the
group.
The
blood
samples
of
these
individuals
after
clinical
interviews
and
entry
criteria
were
taken
at
8:30
am
and
immediately
transferred
to
the
hospital
laboratory
and
factors
of
hematologic
evaluation
was
performed
in
both
groups.
Impedance
method
was
used
to
measure
blood
factors
using
cell
counter.
CBC
measurement
with
Cell
Counter
method
The
KX-21
delivers
decomposing
eighteen
blood
parameter
quickly
and
accurately,
and
reveals
abnormal
samples.
In
order
to
facilitate
the
sampling
of
abnormal
samples
in
the
laboratory,
the
device
displays
the
information
associated
with
abnormal
analysis
with
unusual
symptoms
on
the
monitor
screen.
Therefore,
abnormal
specimens
are
exposed
to
further
analysis
and
review.
The
KX-21
is
used
for
separation
of
blood
by
three
separators
and
two
types
of
reagents.
The
number
of
white
blood
cells
(WBCs)
is
calculated
by
using
the
DC
discovery
method
in
WBC
explorer
container.
The
RBC
and
platelets
are
stopped
in
the
RBC
explorer
container,
and
they
are
measured
using
the
DC
discovery
method.
In
hemoglobin
(HGB)
explorer
container
(HGB),
using
the
non-cyanid
e
method
carried
out
hemoglobin
analyzer
and
measured
hemoglobin
concentration
(8).
Detection
method
via
DC
(Direct
Current)
We
take
the
blood
sample
to
a
predetermined
amount,
dilute
it
to
a
certain
degree,
and
then
enter
into
the
energy
converter.
The
energy
converter
enclosure
has
a
small
hole
that
is
called
an
aperture.
On
both
sides
of
the
aperture,
there
are
electrodes
through
which
passes
direct
flow.
The
blood
cells
stored
in
the
diluted
sample
pass
through
the
aperture
and
cause
the
direct
current
resistance
(i.e.,
the
opposite
current)
change
between
the
electrodes.
With
this
change
and
by
the
pulse
of
electricity
(showing
itself)
the
size
of
the
blood
cell
is
discovered.
The
number
of
blood
cells
is
calculated
by
counting
the
pulses,
and
by
specifying
the
size
of
the
pulse,
a
blood
cell
size
chart
is
plotted.
In
addition,
the
analysis
of
the
graph
can
be
used
to
obtain
various
analytical
data
(8).
Analysis
Parameters
This
device
analyzes
and
decomposes
the
following
parameters
using
three
explorer
containers
and
two
types
of
reactants.
1.
Total
WBC
(White
Blood
Cell)
(Analysis
Law:
Using
the
Discovery
Method
via
DC)
Unit:
The
ratio
of
the
number
of
WBCs
in
1
L
to
the
whole
blood,
the
WBC
unit
10
to
power
3
on
millimeters
square
(10
^
3
/
Cumm).
2.
Lymphocyte
percentage
(white
blood
cells
and
small
cell
volume)
Unit:
ratio
(because
it
is
uncountable
with
percentage).
The
ratio
(percentage)
of
lymphocytes
(small
cells)
to
the
total
WBC.
3.
MXD%
(WBC
and
middle
cell
volume)
Unit:
Ratio
(percentage
total
sum
of
basophils,
isinophils
and
monocytes
(middle
cells)
to
total
WBC)
4.
Neutrophil
percentage
(WBC
and
large
cell
volume)
Unit:
ratio
(%)
of
neutrophils
(large
cells)
to
the
whole
WBC
5.
Lymphocyte
count
(WBC
and
small
cell
count)
Unit:
The
ratio
of
the
absolute
number
of
lymphocytes
(small
cells)
in
1
L
of
the
total
blood
(8).
6.
MXD%
(WBC
and
middle
cell
count)
Unit:
ratio
of
absolute
number
of
basophils,
isinophils
and
monocytes
(middle
cells)
in
1
L
of
total
blood
7.
Number
of
neutrophils
(WBC
and
large
cell
count)
Unit:
The
ratio
of
absolute
number
of
neutrophils
(large
cells)
in
1
L
of
the
total
blood
8.
RBC
(red
blood
cell)
(Analysis
Law:
Using
Discovery
Method
via
DC)
Unit:
The
ratio
of
RBC
to
1
L
of
the
total
blood.
The
RBC
unit
is
million
/
Cumm.
9.
ESR
is
the
erythrocyte
sedimentation
rate.
Sedimentation
rate
is
total
amount
of
RBC
in
a
saline
or
plasma
solution
at
a
given
time,
which
is
nonspecific.
The
ESR
unit
is
millimeter
per
hour
(mm
/
hr).
10.
RDW
The
distribution
of
the
red
blood
cells
represents
the
amplitude
of
the
dispersion
of
the
total
volume
of
the
RBC.
Unit
of
measurement:
percentage
(%).
11.
MCV
is
the
average
volume
of
red
blood
cells.
Unit
is
femtolite
(fl).
12.
HGB
(Hemoglobin)
(Analysis
Law:
Using
“non-cyanid
e
analysis
of
hemoglobin”)
The
proportion
of
hemoglobin
in
1
dL
of
the
total
blood.
Unit
of
measurement:
gram-per-decilitre
(gr
/
dl).
13.
HCT
(hematocrit
values)
(Analysis
Law:
Using
the
Red
blood
cell
pulse
rate
detection
method)
Ratio
(percentage)
of
total
RBC
volume
in
the
whole
blood
14.
Average
red
blood
cell
volume
The
average
volume
of
RBC
(fL)
in
total
blood,
measured
by
hematocrit
/
RBC
15.
Average
hemoglobin
red
blood
cell
The
average
volume
of
hemoglobin
(pg)
in
RBC,
which
is
measured
by
hemoglobin
/
RBC
Unit
of
measurement:
picogram
(pg)
(8).
16.
Average
hemoglobin
concentration
of
red
blood
cells
The
average
hemoglobin
concentration
in
RBC,
which
is
measured
by
hemoglobin
/
hematocrit.
Unit
of
measurement:
gram-per-decilitre
(gr
/
dl).
17.
Platelet
(Analysis
Law:
Using
“Discovery
Method
via
DC”)
The
number
of
platelets
in
1
L
of
the
total
blood
Platelet
distribution
width
The
distribution
width
(fL)
with
a
height
of
20%
of
the
floor,
when
the
peak
in
the
distribution
of
platelet
particles
is
assumed
to
be
100%.
18.
The
average
platelet
volume
of
the
MPV
in
a
platelet
similar
to
MCV
is
for
RBCs
(8).
Unit
of
measurement:
The
femtoliter
(fl)
Data
from
the
studied
subjects
were
analyzed
by
KS
test
for
normalization.
Then,
normal
data
were
analyzed
by
t-test
and
non-normal
by
Mann
Whitney
U
test.
Alpha
()
less
than
0.05
was
significant.
In
our
study
100
subjects
participated
(50
experimental
and
50
control).
The
mean
and
standard
deviation
of
their
age
was
(38/252
±
9/465)
years.
Table
1:
Frequency
tables

Click
here
for
Table
2:
Age
of
test
and
control
group
Table
3:
Default
Testing
Normality
of
Data
Distribution
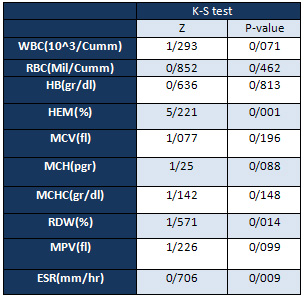
Default
Testing
Normality
of
Data
Distribution
using
the
K-S
test
shows
that
most
variables
have
a
normal
distribution
(the
significant
level
of
most
variables
is
higher
than
5%).
Click
here
for
Table
4:
Red
blood
cell
count
(RBC
Mil
/
Cumm)
of
exposed
workers
to
benzene
with
control
group
Due
to
the
normal
distribution
of
data,
independent
t-test
was
used
to
compare
the
mean
of
two
groups.
According
to
the
results
of
data
analysis,
there
was
no
significant
difference
between
the
levels
of
red
blood
cells
(RBC)
of
workers
exposed
to
benzene
with
the
control
group
(P>
0/05).
Click
here
for
Table
5:
The
white
blood
cell
(WBC
10
^
3
/
Cumm)
of
workers
exposed
to
benzene
with
control
group
Due
to
the
normal
distribution
of
data,
independent
t-test
was
used
to
compare
the
mean
of
two
groups.
According
to
the
results
of
data
analysis,
there
was
no
significant
difference
between
the
levels
of
white
blood
cells
(WBC)
of
workers
exposed
to
benzene
with
the
control
group
(P>
0/05).
Click
here
for
Table
6:
The
average
volume
of
red
blood
cells
(MCV
fl)
of
workers
exposed
to
benzene
and
a
control
group
Due
to
the
normal
distribution
of
data,
independent
t-test
was
used
to
compare
the
mean
of
two
groups.
According
to
the
results
of
data
analysis,
there
was
no
significant
difference
between
the
average
volumes
of
red
blood
cells
(MCV)
of
workers
exposed
to
benzene
with
the
control
group
(P>
0/05).
Table
7:
Distribution
of
red
blood
cells
(RDW
%)
of
workers
exposed
to
benzene
and
control
group.


Due
to
the
unusual
nature
of
the
data
in
the
RDW
distribution,
Mann-Whitney
test
was
used
to
compare
the
study
parameters.
Based
on
the
results
of
the
data
analysis
between
the
red
blood
cell
distribution
(RDW)
there
was
no
significant
difference
between
subjects
exposed
to
benzene
and
control
group
(P>
0.05).
Click
here
for
Table
8:
Average
hemoglobin
in
each
cell
(MCH
pgr)
of
exposed
workers
to
benzene
with
control
group
Due
to
the
normal
distribution
of
data,
independent
t-test
was
used
to
compare
the
mean
of
two
groups.
According
to
the
results
of
data
analysis,
there
was
no
significant
difference
between
the
Average
hemoglobin
in
each
cell
(MCH)
of
workers
exposed
to
benzene
with
the
control
group
(P>
0/05).
Click
here
for
Table
9:
Mean
red
blood
cell
concentration
(MCHC
gr
/
dl)
of
workers
exposed
to
benzene
and
a
control
group
Due
to
the
normal
distribution
of
data,
independent
t-test
was
used
to
compare
the
mean
of
two
groups.
According
to
the
results
of
the
data
analysis,
there
is
a
significant
difference
between
the
mean
concentration
of
MRC
in
red
blood
cells
(MCHC)
of
workers
exposed
to
benzene
and
the
control
group
(P
<0.05).
According
to
the
mean
of
the
two
groups,
the
mean
concentration
of
red
blood
cell
(MCHC)
in
the
control
group
is
more
than
exposed
group
of
benzene.
Click
here
for
Table
10:
The
mean
platelets
volume
(MPV
fl)
of
workers
exposed
to
benzene
and
control
group
Due
to
the
normal
distribution
of
data,
independent
t-test
was
used
to
compare
the
mean
of
two
groups.
According
to
the
results
of
data
analysis,
there
was
no
significant
difference
between
the
mean
volumes
of
platelets
(MPV)
of
workers
exposed
to
benzene
with
the
control
group
(P>
0/05).
Click
here
for
Table
11:
Hemoglobin
(HBg
/
dl)
of
workers
exposed
to
benzene
and
control
group
Due
to
the
normal
distribution
of
data,
independent
t-test
was
used
to
compare
the
mean
of
two
groups.
According
to
the
results
of
data
analysis,
there
was
no
significant
difference
between
hemoglobin
levels
of
workers
exposed
to
benzene
with
the
control
group
(P>
0/05).
Table
12:
Hematocrit
(HEM
%)
of
workers
exposed
to
benzene
and
control
group


Due
to
the
lack
of
normal
Hematocrit
data
(HEM),
Mann-Whitney
test
was
used
to
compare
the
study
parameters.
According
to
the
results
of
the
data
analysis,
there
was
no
significant
difference
between
the
hematocrit
(HEM)
subjects
exposed
to
benzene
and
the
control
group
(P>
0.05)
Table
13:
Red
blood
cell
sedimentation
rate
(ESR
mm
/
hr)
of
workers
exposed
to
benzene
and
control
group


Due
to
the
non-normalization
of
the
ESR
data,
the
Mann-Whitney
test
was
used
to
compare
the
study
parameters.
According
to
the
results
of
the
data
analysis
between
the
sedimentation
rate
of
red
blood
cells
(ESR)
there
was
a
significant
difference
between
subjects
exposed
to
benzene
and
the
control
group
(P
<0/05).
The
results
of
this
study
showed
that
blood
parameters
(RBC,
WBC,
MCV,
RDW,
MCH,
MPV,
HB,
HEM)
were
not
significantly
different
in
the
exposed
group
compared
to
the
control
group;
only
MCHC
had
a
significant
difference.
Due
to
Normal
distribution
of
data,
independent
t-test
was
used
to
compare
the
means
of
the
two
groups.
According
to
the
results
of
the
data
analysis,
there
is
a
significant
difference
between
the
mean
concentration
of
red
blood
cells
(MCHC)
exposed
to
benzene
and
the
control
group
(P
<0.05).
Regarding
the
mean
of
the
two
groups,
the
mean
concentration
of
red
blood
cells
(MCHCs)
in
the
control
group
was
higher
than
the
benzene
group.
Based
on
the
results
of
the
data
analysis,
there
was
a
significant
difference
between
the
sedimentation
rates
of
red
blood
cells
(ESR)
in
the
benzene-exposed
group
with
the
control
group.
In
studies
of
blood
factor
changes
such
as
anemia,
aplastic
anemia
and
leukemia
caused
by
exposure
to
benzene,
there
are
conflicting
results
that
require
data
from
long-term
studies
(9).
Parts
of
the
studies
in
this
regard
are
in
line
with
the
findings
of
this
study.
For
example,
Mow
and
Fow
(2004)
concluded
in
their
studies
that
there
was
a
negative
correlation
between
exposure
levels
of
benzene
and
red
blood
cell
count
(10).
In
addition,
Keh
et
al.
(2015)
in
a
study
conducted
between
2005
and
2008
on
a
group
of
Korean
workers,
it
is
stated
that
the
number
of
RBCs
in
the
exposed
workers
with
low
levels
of
benzene
has
a
significant
negative
relationship
(11).
Posotori
et
al.
(2009)
also
in
their
research
concluded
that
benzene
had
no
effect
on
examined
blood
factors
the
153
Bulgarian
petrochemical
workers
(239
ppm
-
0/01)
(12).
Rajia
and
Hall
(2014)
in
their
study
on
60
gasoline
workers,
of
which
40
were
exposed
to
benzene,
compared
to
20
controls
concluded
that
exposure
to
benzene
with
concentrations
of
less
than
1
ppm
has
no
relevance
with
the
reduction
of
red
blood
cells
(9).
Drummond
et
al.
(1988),
in
their
study
on
the
bioavailability
of
workers
exposed
to
benzene,
stated
that
hematotoxic
effects
were
found
at
high
concentrations
of
300
ppm
and
leukemogenetic
effects
at
concentrations
above
100
ppm
(13).
Kirkliet
et
al.
(2008)
examined
the
effect
of
benzene
on
human
blood
and
stated
benzene
altered
the
gene
expression
and
caused
hematological
disorders
(14).
In
numerous
studies,
the
blood-induced
effects
of
exposure
to
benzene
have
been
shown
in
low
concentrations.
Here
can
be
pointed
out
blood
toxicity
especially
in
sensitive
individuals
exposed
to
concentrations
of
1
ppm
or
less
(15)
changes
in
red
blood
cells,
white
blood
cells
and
neutrophils
in
concentrations
of
less
than
0.2
ppm
(16),
increased
hemoglobin
concentration
in
less
than
ppm
5
(17)
reduction
of
lymphocytes,
platelets,
white
blood
cells
and
increase
of
average
cellular
mass
of
red
blood
cells
in
the
presence
of
concentrations
of
10-1ppm
(18).
A
number
of
studies
have
also
pointed
to
the
lack
of
observation
of
abnormal
blood
parameters
in
exposure
to
benzene
at
low
concentrations
in
occupational
environments
(19,
20).
In
concentrations
of
ppm
of
0/01
-
1/4
benzene
has
no
detectable
blood
abnormalities,
and
there
are
no
significant
abnormalities
in
the
periodic
observation
of
workers
in
the
presence
of
benzene
1
to
30
ppm
concentrations,
except
temporary
reduction
in
the
number
of
red
blood
cells
(21).
In
addition,
in
the
study,
Neqab
et
al.
(2011),
at
a
concentration
of
0.24-ppm
benzene
in
a
gas
station
in
Shiraz
examined
400
people,
200
exposed
to
benzene
and
200
controls.
According
to
the
findings,
average
number
of
white
cells
blood,
red
blood
cells,
hemoglobin,
platelets,
mean
cellular
RBC,
average
cell
hemoglobin,
mean
hemoglobin
concentration,
lymphocytes,
monocytes,
neutrophils
and
eosinophils
were
similar
in
both
control
and
exposure
groups
(22).
A
similar
study
during
the
years
1981
and
2007
Sevan
et
al.
(2010)
was
conducted
on
701
workers
exposed
to
concentrations
of
0/1-0/85
ppm
benzene,
compared
to
1059
administrative
staff.
There
were
no
significant
differences
in
the
blood
factors
between
the
two
groups
(it
should
be
noted
that
hemoglobin,
hematocrit,
white
blood
cell,
lymphocyte,
monocytes,
neutrophils,
basophils
were
studied
in
this
study)
(19).
Zamanpour
et
al.
(2003)
examined
400
workers
with
an
average
exposure
of
3.99-ppm
benzene
and
40
employees.
The
average
number
of
white
blood
cells,
red
cells,
the
average
cell
hemoglobin,
mean
hemoglobin
concentration
had
no
significant
difference
in
the
two
groups
of
exposure
and
control
(23).
Of
course,
there
are
conflicting
results
for
example,
Ward
et
al.
(1996)
study
in
a
35-year
on
tyre
manufacturing
factory
workers
indicated
that
there
is
a
significant
relationship
between
exposure
to
benzene
and
anemia,
and
this
result
is
dependent
on
exposure
to
34-ppm
benzene
(24).
Many
cases
of
anemia
have
been
reported
for
years,
when
benzene
was
used
as
a
solvent
in
the
workshops,
including
shoe
manufacturing
and
tyre
manufacturing
workshops
in
high
concentrations
(hundreds
of
milligrams
of
benzene
per
m3)
of
benzene.
When
according
to
the
past,
the
examination
of
workers’
blood
tests
was
done,
the
effect
of
reduction
over
time
was
observed
parallel
to
the
level
of
benzene
reduction
in
the
workshop
air
from
240
mg/m3
to
64-48
mg/m3
(25).
In
addition,
it
was
found
that
workers
exposed
to
benzene
(above
120
mg/m3)
had
a
high
concentration
of
average
levels,
and
their
red
and
white
blood
cells
were
significantly
lower
than
those
exposed
to
benzene
in
the
concentration
below
the
average
levels
(20).
Reduced
red
and
white
blood
cell
count
has
been
reported
at
a
concentration
above
the
benzene
average
level
(120
mg
/
m3),
and
below
32
mg/m3
was
observed
weak
effect,
and
at
concentrations
of
0/03-4/5
mg/M3
have
no
effect
(26).
Hepatotoxicity
studies
of
benzene
show
its
myelotoxic
effects
(27,
28,
and
29).
Also,
several
studies
on
mice
exposed
to
a
minimum
of
320
mg/m3
of
benzene
for
several
weeks
showed
that
a
decrease
in
the
number
of
blood
cells
and
bone
marrow
cells
occurs
as
a
result
of
exposure
to
benzene,
some
of
which
effects
of
benzene
have
been
reported
at
lower
concentrations.
For
example,
in
the
amount
of
32
mg/m3
or
10
ppm
for
25
weeks,
there
is
a
decrease
in
the
number
of
red
blood
cells
and
blood
lymphocytes.
Other
evidence
of
adverse
effects
of
benzene
on
blood-forming
units
on
animals
are
reported
at
concentrations
ranging
from
10
to
300
ppm
and
above
(25).
Miaw
and
Faw
(2004)
in
their
studies
showed
using
multiple
regression
analysis
that
there
is
a
negative
correlation
between
the
levels
of
exposure
to
benzene
and
the
number
of
white
blood
cells
(10).
Posotori
et
al.
(2009)
also
concluded
that
benzene
had
no
effect
on
the
blood
factors
of
153
Bulgarian
petrochemical
workers
exposed
to
benzene
(ppm
0.01-
239).
Only
eosinophils
numbers
were
influenced
by
benzene,
which
was
only
reported
among
smokers,
in
studies
by
Yishun
Dera
and
Rana
(2001)
that
confirmed
this
and
stated
that
alcohol,
tobacco
and
Non-vegetarian
diet
increases
benzene’s
absorption
and
metabolism
in
the
human
body.
In
particular,
excessive
alcohol
consumption
can
alter
the
sensitivity
of
the
human
body
to
benzene
(12).
In
addition,
the
immunological
effects
of
benzene
are
probably
due
to
its
effect
on
bone
marrow.
In
this
study,
he
reported
a
decrease
in
the
ability
to
proliferate
lymphocyte
B
week
after
inhalation
of
benzene
at
a
low
concentration
of
32
mg/m3;
this
response
developed
for
benzene
inhalation
of
lymphocyte
T
at
96
mg/m3
concentration.
Different
types
of
blood
diseases
such
as
aplastic
anemia,
thrombocytopenia,
granulocytes,
lymphocytopenia
are
caused
by
exposure
to
benzene.
As
observed
in
laboratory
animals,
the
organ
that
is
the
primary
target
of
benzene,
which
causes
blood
disorders,
is
bone
marrow
(25).
The
results
of
this
study
indicated
that
minor
leukopenia
would
occur
after
inhalation
of
150
mg/m3
of
benzene
for
32
weeks.
However,
in
another
study,
the
reduction
in
the
number
of
white
blood
cells
in
the
2
to
13
weeks
was
shown,
or
the
reduction
in
bone
marrow
cells
will
occur
in
the
amount
of
960
mg/m3
or
higher
(25).
Studies
per
year
on
105
workers
of
an
oil
company
between
1994
and
1997,
exposed
to
benzene
in
concentrations
between
0.14
and
2.08
parts
per
million
benzenes
indicate
that
time
and
duration
of
exposure
to
benzene
is
associated
with
changes
in
MCV
and
platelet
count.
Decline
in
MCV
is
only
noticeable
among
workers
who
have
worked
for
more
than
10
years
at
this
company.
The
findings
of
this
study
showed
that
low
levels
of
benzene
may
affect
CBC
levels,
and
CBC
can
be
a
useful
tool
for
biological
monitoring
for
exposure
to
low
benzene
levels
(30).
Studies
of
928
workers
in
five
factories
in
and
around
Shanghai,
China
have
achieved
a
wide
range
of
benzene
concentrations,
in
which
benzene-sensitive
parameters
have
been
introduced
as
neutrophils
and
mean
platelet
volume
(MPV)
in
which
effective
benzene
concentrations
in
the
air
is
expressed
from
7.8
to
8.2
in
ppm
(18).
The
process
of
benzene
poisoning
occurs
when
benzene
converts
via
metabolism
into
a
number
of
metabolites
that
bind
into
the
bone
marrow,
and
are
then
converted
by
peroxidases
into
active
and
reactive
species
that,
in
turn,
form
reactive
oxygen
species
(ROS)
(31).
The
average
benzene
concentration
in
the
air
of
the
studied
workshops
was
1.68
ppm.
The
results
of
blood
tests
showed
that
there
was
a
significant
difference
between
the
mean
concentration
of
red
blood
cell
and
the
red
blood
cell
sedimentation
rate
of
workers
exposed
to
benzene
compared
to
the
control
group.
So
that
the
mean
concentration
of
red
blood
cells
(MCHC)
in
the
control
group
is
higher,
and
the
rate
of
sedimentation
of
red
blood
cells
(ESR)
of
workers
exposed
to
benzene
is
higher
than
control
group.
Moreover,
in
other
parameters
there
is
no
significant
difference
between
the
two
groups.
The
average
exposure
of
workers
at
different
workshops
with
benzene
fumes
is
not
exceeded
from
the
permissible
limits
occupational
exposure
to
these
compounds.
In
addition,
it
seems
that
in
the
results
of
the
study,
other
factors
such
as
alcohol
consumption,
smoking,
non-herbal
diet
and
exposure
to
benzene
are
effective.
1.
Aghilinezhad
M,
Mostafaei
M,
Farshad
A,
Ghafari
M.
Occuoational
Medicine
Practice.5th
Ed.
Tehran:Arjmand
;2010;48-49.
2.
Kaiser
R.
“Bicarburet
of
Hydrogen”.R
eappraisal
of
the
Discovery
of
Benzene
in
1825
with
the
Analytical
methods
of
1968.
Angewandte
Chemie
International
(GDCH),
1968;
7(5):
345-350.
3.
Hillis
O.
Folkins
“Benzene”
Ullmanns
encyclopedia
of
industrial
chemistry,
Wiley-vch,
Weinheim.
2005;
403-475.
Doi:
10.1002/14356007.
4.
Minciullo
PL,
Navarra
MH,
Calapai
GC.
Gangemi
ST.
Cytokine
network
involvement
in
subjects
exposed
to
benzene.
J
Immuno
Res,
2014;
4:
1-8.
5.
Bahadar
HJ,
Mostafalou
S,
Abdollahi
M.
Current
understandings
and
perspectives
on
non-cancer
health
effects
of
benzene:
A
global
concern.
Toxicol
Appli
Pharmacol.
2015;
276(2):
83-94.
6.
Sanai
GH.
Industrial
Toxicology.
8thEd.
Tehran:
Tehran
University;
2009;
vol
(1);
318-323.
7.
Kasper
DL,
Brauanwald
EG,
Hauser
SP,
Longo
D,
Jameson
JL,
Fauci
AS.
Harrison’s
principles
of
internal
medicine.
2014;
16th
ed.
st.
Mishawaka:McGraw-Hill.
8.
Sysmex
Corporation
Kobe,
Japan.
Operator’s
manual
automated
hematology
analyzer
KX-21.
2000:219-21.
9.
Ragia
MH,
Hala
FM.
Oxidant
Hepatic
and
/or
Haem.
Injury
on
Fuel-Station
Workers
Exposed
to
Benzene
Vapor,
Possible
Protection
of
Antioxidants.
Amr
J
Med
and
Med
Sci,
2014;
4(2):
35-46.
10.
Miao
LZ,
Fu
H.
Effect
of
low
benzene
exposure
on
workers
peripheral
blood
parameters
of
similar
exposure
groups.
Zhonghua
Lao
Dong
Wei
Sheng
Zhi
Ye
Bing
Za
Zhi.
2004;
22(3):
191-3.
11.
Koh
DH,
Jeon
HK,
Lee
SG,
Ryu
HW.
The
relationship
between
low-level
benzene
exposure
and
blood
cell
counts
Korean
workers.
J
Occup
EnvironMed.2015;
72(6):
421-427.
12.
Pesatori
AC,
Gart
S,
Popov
T,
Georgieva
T,
et
al.
Early
effect
of
low
benzene
exposure
on
blood
cell
counts
in
Bulgarian
petrochemical
workers.
Med
del
Lavoro
.
2009;
100(2):
83-90.
13.
Drummond
L,
Luck
R,
Afacan
AS,
Wilson
HK.
Biological
Monitoring
of
Workers
Exposed
to
benzene
in
the
Coke
Oven
Industry.
Br
J
Ind
Med.1988;
45:
256-261.
14.
Kirkeleit
J,
Riise
T,
Gjertsen
BT,
Moen
BE,
et
al.
Effect
of
Benzene
on
Human
Hematopoiesis.
The
Open
Hematol
J.2008;
2:
87-102.
15.
Lan
Q,
Zhang
L,
Li
G,
Vermeulen
R,
et
al.
Hematotoxicity
in
workers
exposed
to
low
levels
of
benzene.
Scince.2004.
306(5702):
1774-1776.
16.
Qu
Q,
Shore
R,
Li
G,
Jin
X,
et
al.
Haematological
changes
among
Chinese
workers
with
a
broad
range
of
benzene
exposure.
Amr
J
Ind
med.
2002;
42:
275-285.
17.
Liu
CS,
Tsai
JH,
Kuo
SW.
Comparison
of
complete
blood
counts
and
urinary
benzene
metabolites
after
exposure
to
benzene.
Mid-
Taiwan
J
Med.2000.
5:
235-242.
18.
Schanatter
AR,
Kerzic
PJ,
Zhou
YM,
Chen
M,
et
al.
Peripheral
blood
effects
in
benzene-exposed
workers.
Chem-Biol
Inter.2010;
184:
174-181.
19.
Swean
GM,
Amelsvoort
LV,
Twisk
JN,
Verstraeten
EN,
et
al.
Low
level
occupational
benzene
exposure
and
hematological
parameters.
Chem-Biol
Inter.
2010;
184(1-2):
94-100.
20.
Kipen
HM.
Hematologic
effect
of
benzene:
A
thirty-five
year
longitudinal
study
of
rubber
workers.
Toxicol
Ind
health.1988;
4:
411-430.
21.
Hunter
D,
Raffle
A,
Adams
P.
Hunter’s
diseases
of
occupations,
8th
edition.1994;
190-195.
22.
Neghab
MS,
Hosseinzadeh
KM,
Hassanzadeh
JF.
Early
liver
and
kidney
dysfunction
associated
with
occupational
exposure
to
sub-threshold
limit
value
levels
of
benzene,
toluene,
and
xylenes
in
unleaded
petrol.
J
saf
health
work.2015;
21:1-5.
23.
Zamanipur
SH,
Mortazavi
Y,
Kaviani
S.
Occupational
exposure
to
benzene
and
its
associated
hematologic
side
effects
.J
Zanjan
university
Med
Health
services
.2003;
(39):
13-20.
24.
Ward
EA,
Hornung
RH,
Morris
JM,
Rinsky
RB,
et
al.
Risk
of
low
red
or
with
blood
cell
count
related
to
estimated
benzene
exposure
in
a
rubber
worker
cohort.
Amer
J
Ind
Med,
1996;
29(3):
247-257.
25.
Benzene,
Geneva.
Evaluation
Health
Criteria.
World
Health
Organization
.1993,
150.
26.
Cody
RP.
Strawderman
WW,
Kipen
HM.
Hematologic
effect
of
benzene.
Job-specific
trends
during
the
first
year
of
employment
among
a
cohort
of
benzene
–exposed
rubber
workers.
J
Occup
med.
1993;
35:
776-782.
27.
Crump
K,
Allenn
B.
Quantitative
estimates
of
risk
of
leukaemia
from
occupational
exposure
to
benzene.
Washington,
DC,
US
Department
of
Labor.
OSHA
Docket
H-059b,
Exhibit
1984;
152,
Annex
B.
28.
Rinsky
RA.
Benzene
and
leukaemia.
An
epidemiologic
risk
assessment.
New
Eng
J
Med.1987;
316:
1044-1050.
29.
Paustenbach
DJ,
et
al.
Reevaluation
of
benzene
exposure
for
the
plifilm
(rubberworker)
cohort
(1936-1976).
J
toxicol
environ
health.
1992;
36:
177-230.
30.
Khuder
SA,
Youngdal
MC,
Bisesi
MS,
and
Schaub
EA.
Assessment
of
complete
blood
count
variation
among
workers
exposed
to
low
levels
of
benzene.
J
Occup
Environ
Med.1999;
41(9):
821-826.
31.
Elsayed
AS.
Hematotoxicity
and
oxidative
stress
caused
by
benzene.
Pyrex
J
Biomed
Res.2015;
1(6):
074-080.