| CRITICAL
APPRAISAL
OF
THERAPY
PAPER
|
The
quality
of
clinical
trials
may
be
defined
as
the
confidence
in
the
design,
conduct,
report,
and
analysis
that
restrict
bias
in
the
comparison
of
interventions.
Critical
appraisal
of
therapy
paper
is
achieved
by
answering
3
questions:
1.
Are
the
results
of
the
trial
valid?
2.
How
large
and
precise
are
the
treatment
effect?
3.
Will
the
results
help
me
in
caring
for
my
patient?
| ASSESSMENT
OF
INTERNAL
VALIDITY |
This
is
a
crucial
step
before
starting
to
use
the
results
of
a
study.
To
assess
the
validity
means
to
ask
if
the
findings
are
true
and
accurate.
It
implies
that
the
study
is
designed
well
and
rigorously
conducted
to
reduce
potential
bias
.
One
should
actively
look
at
the
study
methodology
to
assess
what
was
planned
and
the
results
ensure
that
it
was
actually
done.
It
is
common
to
find
a
study
described
as
being
randomized
and
upon
careful
assessment,
is
found
to
have
poor
randomization
process.
The
following
RCT
components
have
to
be
critically
evaluated
to
ensure
validity:
1.
Randomization
2.
Concealed
allocation
3.
Balanced
groups
4.
Blinding
5.
Equal
treatment
6.
Compliance
7.
Complete
follow
up
8.
Intention
to
treat
analysis
1.
Randomization
The
patient
distribution
(allocation)
has
two
steps:
the
first
step
is
generation
of
randomization
list,
which
is
most
often
performed
by
computer
programs;
and,
the
second
step
is
execution
of
allocation
by
concealment.
Randomization
is
a
process
by
which
each
subject
has
50%
chance
to
be
distributed
to
the
intervention
or
the
control
group.
By
randomization,
the
prognostic
factors
are
distributed
equally,
which
results
in
two
balanced
groups.
The
balance
of
distribution
includes
both
the
known
(age,
gender,
co-morbidities)
and
the
unknown
prognostic
factors
(hereditary
and
genetic).
Randomization
protects
against
selection
bias.
2.
Concealed
allocation
This
means
that
neither
the
research
team
nor
the
patient
should
know
to
which
group
the
next
patient
will
be
allocated
to.
If
the
next
assignment
is
known,
enrollment
of
certain
patients
may
be
prevented
or
delayed
to
ensure
that
they
receive
the
treatment
believed
to
be
superior.
Concealed
allocation
is
based
on
the
sequence
generated
randomization
list.
Adequate
randomization
requires
that
the
allocation
of
the
next
patient
be
unpredictable.
Therefore,
randomization
list
must
be
kept
and
managed
by
somebody
who
is
not
part
of
the
study
(i.e.,
neither
the
research
team
nor
the
subject).
This
may
be
translated
by
one
of
two
methods:
Remote
telephone
call
can
be
made
especially
in
multicenter
trials.
Enrolment
of
eligible
subjects
through
a
telephone
call
from
the
center
that
controls
the
randomization
list
will
automatically
get
response
and
indicate
the
distribution
arm
(e.g.,
A
or
B).
A
second
method
is
by
sequentially
numbering
sealed-opaque
envelopes
with
the
distribution
(e.g.,
A
or
B)
on
a
small
piece
of
paper
inside
it.
But
previous
evidence
demonstrated
that
envelopes
may
be
trans-illuminated.
However,
it
is
still
debatable
whether
sealed
envelopes
truly
provide
adequate
allocation
concealment.
3.
Balanced
Groups
If
the
randomization
process
worked
(that
is,
achieved
comparable
groups)
the
groups
should
be
similar.
The
more
similar
the
groups,
the
better
it
is.
There
may
be
some
indication
of
whether
differences
between
groups
are
statistically
significant
(i.e.,
p
values).
The
Results
should
have
a
table
of
"Baseline
Characteristics,"
which
compares
the
randomized
groups
on
a
number
of
variables
that
could
affect
the
outcome
(i.e.,
age,
risk
factors,
etc.).
4.
Blinding
(Masking)
In
RCT,
the
term
"blinding"
refers
to
keeping
participants,
health-care
providers,
data
collectors,
outcome
assessors,
and/or
data
analysts
unaware
of
the
assigned
intervention.
The
purpose
of
blinding
is
to
prevent
bias
associated
with
patients'
and
investigators'
expectations.18
Blinding
usually
reduces
outcome
assessment
bias,
improves
compliance,
and
reduces
drop-out
and
co-intervention.
Blinding
also
protects
against
performance
bias
(i.e.,
systematic
differences
in
the
care
provided
to
the
participants
in
the
comparison
groups
other
than
the
intervention
under
investigation).
Ideally,
to
minimize
bias,
both
the
participant
and
the
investigator
are
kept
blind
to
(ignorant
of)
the
random
assignment.
The
definition
of
single-,
double-,
and
triple-blinding
varies.
Investigators
should
implement
the
greatest
level
of
blinding
that
is
feasible.
If
possible,
the
following
level
of
blinding
should
be
achieved:
•
The
patient:
to
avoid
placebo
effect
and
contamination;
•
Clinicians:
to
prevent
co-intervention;
•
Nurses:
to
prevent
co-intervention;
•
Data
collectors:
to
prevent
bias
in
data
collection;
•
Outcome
assessors:
to
prevent
detection
bias;
•
Data
analyst:
to
prevent
bias
related
to
decision
about
data
analysis;
•
Any
other
personnel
who
are
dealing
with
patients
and
who
are
part
of
the
research
team
(i.e.,
pharmacists,
dietician,
health
educator,
physiotherapist,
etc).
If
interventions
are
compared
with
no
intervention,
an
identical
placebo
may
be
used.
The
compared
interventions
must
be
identical
in
taste,
smell,
appearance,
and
mode
of
administration.
5.
Equal
Treatment
Investigator
should
ensure
that
apart
from
the
intervention
the
patients
in
the
different
groups
should
be
treated
the
same
in
terms
of
additional
treatments
or
tests.
The
results
should
include
a
section
for
the
follow-up
schedule
and
permit
for
additional
treatments
or
contamination.
Contamination
occurs
when
either
the
intervention
group
or
the
control
group
receives
part
or
all
of
the
other
group
treatment.
For
example,
in
a
trial
of
dietary
change,
people
in
the
control
group
might
learn
about
the
experimental
diet
and
adopt
it
themselves.
Contamination
may
reduce
the
point
estimate
on
the
intervention.
Two
ways
are
used
to
reduce
the
effect
of
contamination:
first,
by
increasing
the
sample
size;
and
second,
by
cluster
randomization
where
no
interaction
is
allowed
between
intervention
and
control
group
(e.g.,
schools
and
PHCs
randomization).
Co-intervention
implies
additional
Interventions
other
than
the
treatment
or
procedure
defined
per
protocol
under
study
that
is
applied
differently
to
the
treatment
and
control
groups.
Co-intervention
is
a
serious
problem
when
double
blinding
is
absent
or
when
the
use
of
very
effective
non-study
treatment
is
permitted.
Example
is
the
multiple
sclerosis
trial;
the
new
drug
may
appear
to
be
more
effective
at
the
end
of
the
trial
if
patients
allocated
to
the
new
drug
received
physiotherapy
earlier
and
more
intensively
than
patients
allocated
to
placebo.
6.
Compliance
Usually,
treatment
efficacy
is
based
on
the
compliant
subjects.
Non-compliance
with
treatment
regimen
is
a
common
protocol
violation
in
RCT.
It
compromises
the
desired
rigor
of
the
trial.
Non-compliance
can
seriously
decrease
study
power
resulting
in
widely
varying
estimates
of
the
sample
size
required
for
a
study.
Thus,
non-compliance
is
a
significant
issue
to
be
considered
when
appraising
trials
involving
long-term
therapies.
7.
Follow-up
Dropout
in
RCT
is
common
and
threatens
the
validity
of
results,
as
completers
may
differ
from
people
who
drop
out.
Lost
to
follow
up
includes
all
patients
whose
status
is
not
known
at
the
end
of
the
study,
such
as:
•
Complete
non
follow-up
-
left
study
•
Incomplete
follow
up
-
missed
some
visits
•
Data
was
not
collected
or
missing
•
Data
was
corrupted
or
not
analyzed
Rubin,
and
Donald
(1976),
classified
dropout
as:
a.
Administrative:
If
patients
withdraw
from
a
study
for
a
reason
unrelated
to
their
disease
or
treatment
(for
example,
because
they
have
moved
overseas)
their
data
are
probably
missing
completely
at
random,
because
of
no
systematic
differences
between
them
and
the
patients
who
remained
in
the
study.
b.
Clinical:
If
patients
withdraw
from
the
study
for
reasons
related
to
their
disease
or
treatment
(e.g.,
progression
or
toxicity);
their
quality
of
life
measures
would
have
been
worse
than
those
of
patients
who
remained
in
the
study.
Some
authors
considered
loss
to
follow-up
of
5%
or
lower,
is
usually
of
little
concern;
whereas,
a
loss
of
20%
or
greater
means
that
readers
should
be
concerned
about
the
possibility
of
bias.
Losses
between
5%
and
20%
may
still
be
a
source
of
bias.
c.
If
investigators
stop
following
patients
who
do
not
adhere
to
the
study
protocol,
they
will
be
unaware
if
those
patients
suffered
the
target
outcome.
Investigators
often
include
patients
lost
to
follow-up
in
the
denominators
in
calculating
estimates
of
effect.
This
approach
assumes
that
none
of
those
lost
to
follow-up
suffered
the
target
outcome.
Making
this
unlikely
assumption
opens
the
door
to
a
misleading
presentation
of
study
results.
Alternative
strategies
are
available
that
impute
outcomes
to
those
lost
to
follow
up.
Some
of
these
strategies
include:
i.
Attempt
to
follow
up
all
randomized
participants:
Following
up
participants
who
withdraw
from
randomized
treatment
can
be
difficult
but
is
important
because
they
may
differ
systematically
from
those
who
remain
on
treatment.
A
trial
that
does
not
attempt
to
follow
participants
after
treatment
withdrawal
cannot
claim
to
follow
the
intention
to
treat
principle
ii.
Perform
plausible
main
analysis:
The
main
analysis
should
be
chosen
to
be
valid
under
a
plausible
assumption
about
the
missing
data.
For
example,
in
a
hypothetical
trial,
consider
in
100
participants,
10
had
dropped-out
at
6
months
and
the
rest
(90
participants)
are
followed
at
least
to
12
months.
The
outcomes
at
6
months
are
similar
in
those
dropped
out
and
the
completers.
In
case
the
reason
of
drop-out
of
the
10
participants
is
administrative
(not
treatment
or
disease
related),
it's
logical
to
consider
that
the
outcome
rate
remains
similar
in
both
groups
at
12
months.
iii.
Perform
sensitivity
analyses:
For
a
bad
outcome,
apply
the
worst
case
scenario
for
lost
to
follow
up
at
the
intervention
arm
and
best
case
scenario
for
lost-to-follow
up
at
the
control
arm.
8.
Intention
to
Treat
Principle
(ITT)
There
is
ongoing
debate
on
which
participants
should
be
analyzed.
Per
protocol
analysis
(i.e.,
efficacy
analysis,
explanatory
analysis,
or
analysis
by
treatment
administered)
describes
the
outcomes
of
the
participants
who
adhered
to
the
research
protocol.
Although
investigators
can
use
information
from
such
an
analysis
to
estimate
the
intervention's
efficacy
in
those
who
actually
received
it
in
the
intended
intensity
or
dose
for
the
intended
interval;
this
estimate
is
likely
to
be
seriously
flawed.
The
problem
arises
because
the
reasons
for
non-adherence
to
the
protocol
may
be
related
to
prognosis.
ITT
analysis
includes
all
randomized
patients
in
the
groups
to
which
they
were
randomly
assigned
and
their
outcomes,
regardless
of
their
adherence
with
the
entry
criteria,
regardless
of
the
treatment
they
actually
received,
and
regardless
of
subsequent
withdrawal
from
treatment
or
deviation
from
the
protocol.
In
other
words,
ITT
analysis
includes
every
subject
who
is
randomized
according
to
randomized
treatment
assignment.
It
ignores
non-compliance,
protocol
deviations,
withdrawal,
and
anything
that
happens
after
randomization.
Excluding
non-compliant
or
deviators
may
overestimate
the
efficacy
of
intervention
by
ignoring
the
harm
that
resulted
in
non-compliance
and
deviation.
ITT
analysis
reflects
the
practical
clinical
scenario
because
it
admits
non-compliance
and
protocol
deviations.
ITT
analysis
maintains
prognostic
balance
generated
from
the
original
random
treatment
allocation.
It
gives
an
unbiased
estimate
of
treatment
effect.
If
non-compliant
subjects
and
dropouts
are
excluded
from
the
final
analysis,
it
might
create
important
prognostic
differences
among
treatment
groups.
Moreover,
subjects
may
be
non-compliant
or
may
drop
out
from
the
study
due
to
their
response
to
treatment.
ITT
analysis
preserves
the
sample
size
because
if
non-compliant
subjects
and
dropouts
are
excluded
from
the
final
analysis,
it
might
significantly
reduce
the
sample
size,
leading
to
reduced
statistical
power.
The
drawback
of
ITT
analysis
is
that,
it
is
too
cautious
and
more
susceptible
to
type
II
error
(cannot
reject
null
hypothesis
in
the
setting
of
effective
treatment);
and
it
is
less
likely
to
show
a
positive
treatment
effect.
A
full
application
of
the
ITT
analysis
is
only
possible
when
complete
outcome
data
are
available
for
all
randomized
subjects.
In
other
words,
ITT
analysis
cannot
minimize
bias
introduced
by
loss
to
follow-up,
that
is,
patients
whose
outcome
status
is
unknown.
| ASSESSMENT
OF
TREATMENT
EFFECT
|
Most
often,
results
are
presented
as
dichotomous
outcomes
(yes
or
no
outcomes
that
happen
or
don't
happen)
and
can
include
such
outcomes
as
cancer
recurrence,
myocardial
infarction,
and
death.
Two
types
of
measure
effects
are:
1.
How
large
was
the
treatment
effect
(magnitude)?
-
Relative
effects
(Relative
Risk
[RR]
and
Relative
Risk
Reduction
[RRR])
-
Absolute
effects
(Absolute
Risk
Reduction
[ARR]
and
number
needed
to
treat
[NNT])
2.
How
precise
was
the
estimate
of
the
treatment
effects?
-
95%
confidence
interval
(CI)
1.
Relative
Risk
The
relative
risk
(RR)
tells
us
how
many
times
more
likely
it
is
that
an
event
will
occur
in
the
treatment
group
relative
to
the
control
group.
An
RR
of
1
means
that
there
is
no
difference
between
the
two
groups
thus,
the
treatment
had
no
effect.
An
RR<1
means
that
the
treatment
decreases
the
risk
of
the
outcome.
An
RR>1
means
that
the
treatment
increased
the
risk
of
the
outcome.
RR
is
a
ratio
of
probabilities.
It
compares
the
incidence
or
risk
of
an
event
among
those
with
a
specific
exposure
with
those
who
were
not
exposed
(e.g.,
myocardial
infarctions
in
those
who
smoke
cigarettes
compared
with
those
who
do
not).
RR
is
based
upon
the
incidence
of
an
event
given
that
we
already
know
the
study
participants'
exposure
status.
It
is
only
appropriate,
therefore,
to
use
RR
for
prospective
cohort
studies.
Consider
this
example
of
an
RCT
using
Voglibose
by
Impaired
Fasting
Glucose
patients
to
prevent
progression
to
Type-2
diabetes
mellitus.
Subjects
treated
with
voglibose
had
a
significantly
lower
risk
for
progression
to
type-2
diabetes
than
those
in
placebo
group
(Table
1).
Table
1:
Voglibose
50/897
vs
Placebo
106/881
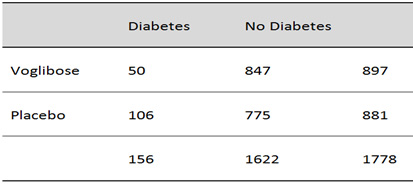
Table
1
shows
the
dataset
of
patients
treated
with
either
Voglibose
or
placebo.
This
example
can
be
used
to
calculate
the
treatment
effect
(RR,
RRR,
ARR
and
NNT).
The
risk
(incidence)
of
diabetes
among
those
treated
with
Voglibose
may
be
calculated
using
the
experimental
event
rate
(EER)
or
Risk
in
the
treatment
group
(Rt):
EER
=
50
÷
897
=
0.0557
The
risk
(incidence)
of
diabetes
among
Control
group
is
equal
to
control
event
rate
(CER)
or
Risk
in
control
group
(Rc):
CER
=
106
÷
881
=
0.1203
From
these
two
risks,
the
RR
is
calculated
as:
RR
=
EER
÷
CER
=
0.0557
÷
0.1203
=
0.46
A
RR
of
0.46
means
that
the
probability
of
voglibose
users
to
develop
type-2
diabetes
is
0.46
times
that
of
the
controls.
This
is
called
also
Risk
Ratio
and
Risk
Remaining.
Risk
Remaining
indicates
the
risk
occurrence
in
spite
of
using
the
intervention.
2.
Relative
Risk
Reduction
The
relative
risk
reduction
(RRR)
is
a
complement
of
RR
and
is
probably
the
most
commonly
reported
measure
of
treatment
effects.
It
tells
us
the
reduction
in
the
rate
of
the
outcome
in
the
treatment
group
relative
to
that
in
the
control
group
(Figure
2).
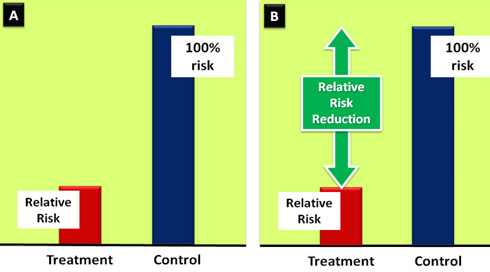
Figure
2:
Graphical
depiction
of
the
relationship
between
the
RR
and
RRR
RRR
=
1
-
RR
RRR
=
1
-
0.46
=
0.54
=
54%
The
treatment
reduced
the
risk
of
diabetes
by
54%
relative
to
that
occurring
in
the
control
group.
3.
Absolute
Risk
Reduction
The
absolute
risk
reduction
(ARR)
tells
the
absolute
difference
in
the
rates
of
events
between
the
two
groups
and
gives
an
indication
of
the
baseline
risk
and
treatment
effect.
An
ARR
of
0
means
that
there
is
no
difference
between
the
two
groups
thus,
the
treatment
had
no
effect.
It
is
calculated
as
the
difference
in
the
risk
of
the
outcome
in
the
control
group
compared
to
the
risk
of
the
outcome
in
the
treatment
group.
This
is
also
known
as
the
risk
difference:
ARR
=
CER
-
EER
ARR
=
12.03%
-
5.57%
=
6.46%
4.
Number
Needed
to
Treat
The
number
needed
to
treat
(NNT)
is
the
number
of
patients
you
need
to
treat
to
prevent
one
additional
bad
outcome
(e.g.,
death,
stroke,
etc.).
For
example,
if
a
drug
has
an
NNT
of
10,
it
means
you
have
to
treat
10
people
with
the
drug
to
prevent
one
additional
bad
outcome.
The
duration
of
the
treatment
has
to
be
incorporated
in
the
assessment
of
the
NNT.
To
calculate
the
NNT,
you
need
to
know
the
ARR
since
the
NNT
is
the
inverse
of
the
ARR:
NNT
=
1
÷
ARR
NNT
=
1
÷
6.46
=
16
Therefore,
in
this
example,
16
subjects
have
to
be
treated
with
voglibose
for
an
average
of
4
years
to
prevent
one
case
of
type-2
diabetes.
RRR
does
not
take
into
account
the
individuals'
risk
of
achieving
the
intended
outcome
without
the
intervention.
Therefore,
they
do
not
give
a
true
reflection
of
how
much
benefit
the
individual
would
derive
from
the
intervention,
as
they
cannot
discriminate
between
small
and
large
treatment
effects.
They
usually
tend
to
overemphasize
the
benefits
of
an
intervention
and,
for
this
reason,
drug
companies
and
the
popular
media
love
RR
measures!
ARR
measures
overcome
these
drawbacks
because
they
reflect
the
baseline
risk
and
are
better
at
discriminating
between
small
and
large
treatment
effects.
Using
the
data
from
Table
1,
you
will
recall
that
we
calculated
the
ARR
as
6.46%
and
the
relative
risk
reduction
as
54%.
Fifty
four
percent
reductions
in
risk
feels
more
impressive
than
6.46%.
Consider
an
example
of
disease
with
rare
event
rate
(e.g.,
2
in
10,000).
The
proposed
treatment
reduced
the
event
rate
to
1
per
10,000:
The
CER
is
2/10,000=0.0002
The
EER
is
1/10,000
=0.0001
The
relative
risk
is
0.0001/0.0002=0.5
The
RRR
at
50%
is
obvious
that
the
50%
reduction
may
not
be
as
important
as
it
looks.
On
further
analyzing
the
ARR
0.0002-0.0001=0.0001,
has
very
tiny
small
benefit.
How
small
the
treatment
effect
is,
it
becomes
even
more
obvious
after
calculating
the
NNT:
NNT
=
1/AAR
=
1/0.0001=10,000
Thus,
10,000
patients
must
be
treated
to
prevent
one
event.
| PRECISION
OF
THE
ESTIMATES
OF
TREATMENT
EFFECT |
The
true
risk
of
the
outcome
in
the
population
is
not
known
and
the
best
we
can
do
is
estimate
the
true
risk
based
on
the
sample
of
patients
in
the
trial.
This
estimate
is
called
the
point
estimate.
We
can
gauge
how
close
this
estimate
is
to
the
true
value
by
looking
at
the
confidence
intervals
(CI)
for
each
estimate.
If
the
CI
is
fairly
narrow
then
we
can
be
confident
that
our
point
estimate
is
a
precise
reflection
of
the
population
value.
The
CI
also
provides
us
with
information
about
the
statistical
significance
of
the
result.
If
the
value
corresponding
to
no
effect
falls
outside
the
95%
confidence
interval,
then
the
result
is
statistically
significant
at
the
0.05
level.
If
the
confidence
interval
includes
the
value
corresponding
to
no
effect,
then
the
results
are
not
statistically
significant.
| APPLICATION
OF
STUDY
RESULTS
TO
MY
PATIENT |
One
should
consider
focusing
on
issues
related
to
intervention,
patient,
potential
harm,
and
patient
preference
[IPPP].
The
first
issue
to
address
is
how
confident
you
are
that
you
can
apply
the
results
to
a
particular
patient
or
patients
in
your
practice.
If
the
patient
would
have
been
enrolled
in
the
study
had
he/she
been
eligible?
Patient
is
eligible
if
he/she
meets
all
the
inclusion
criteria,
and
does
not
violate
any
of
the
exclusion
criteria.
In
this
case,
there
is
doubt
that
the
results
are
applicable.
If
this
is
not
the
case,
judgment
is
required.
A
better
approach
than
rigidly
applying
the
study's
inclusion
and
exclusion
criteria
is
to
ask
whether
there
is
some
compelling
reason
why
the
results
should
be
applied
to
the
patient.
A
compelling
reason
usually
would
not
be
found,
and
most
often
you
can
generalize
the
results
to
your
patient
with
confidence.
If
the
article's
results
are
generalizable
to
your
patient
and
its
outcomes
are
important,
the
next
question
concerns
whether
the
probable
treatment
benefits
are
worth
the
effort
that
you
and
your
patient
must
put
into
the
enterprise.
For
any
RCT,
safety
issues
have
to
be
considered
as
secondary
outcome.
A
fair
balance
must
exist
between
the
magnitude
of
benefit
and
potential
harm.
As
discussed
earlier,
NNT
can
tell
you
the
likelihood
of
benefit.
Nevertheless,
for
each
intervention
we
should
also
calculate
the
number
needed
to
harm
(NNH),
i.e.,
the
number
of
patients
needed
to
treat
before
having
serious
harm.
We
might
not
hesitate
to
treat
even
as
many
as
400
patients
to
save
one
life
if
the
treatment
was
cheap,
easy
to
apply,
compliant,
and
safe.
In
reality,
however,
treatments
usually
are
expensive
and
they
carry
risks.
The
patient
is
an
integral
part
of
the
management.
One
of
the
most
common
sources
of
patient
dissatisfaction
is
not
feeling
properly
informed
about
(and
involved
in)
their
treatment.
Shared
decision-making,
where
patients
are
involved
as
active
partners
with
the
clinician
in
treatment
decisions,
can
be
recommended
as
an
effective
way
to
tackle
this
problem.
Though
unlikely,
a
patient
may
prefer
to
avoid
taking
treatment
with
clear
benefit
and
small
harm,
merely
due
to
cultural
or
religious
reasons.
On
concluding
this
chapter,
we
hope
that
you
are
developing
a
sense
of
how
to
use
evidence-
based
medicine
module
to
appraise
therapy
article.(40,
41)
Once
you
find
an
article
relevant
to
the
therapeutic
issue,
be
sure
to
assess
the
quality
of
the
evidence.
If
the
quality
of
the
evidence
is
poor,
any
subsequent
inference
(and
the
clinical
decision
it
generates)
will
be
weakened.
If
the
quality
of
the
evidence
is
adequate,
determine
the
range
within
which
the
true
treatment
effect
likely
falls.
Then,
consider
the
extent
to
which
the
results
are
generalizable
to
the
patient
at
hand,
and
whether
the
outcomes
that
have
been
measured
are
important.
If
the
generalizability
is
in
doubt
or
the
importance
of
the
outcomes
questionable,
support
for
a
treatment
recommendation
will
be
weakened.
Finally,
by
taking
into
account
the
patient's
risk
of
adverse
events,
assess
the
feasibility
of
the
intervention.
This
involves
a
balance
sheet
looking
at
the
probability
of
benefit;
and
the
associated
costs
and
risks.
Different
aspects
of
the
balance
sheet
help
to
guide
your
treatment
decision.
1.
Kjaergard
LL,
Villumsen
J,
and
Gluud
C.
Reported
methodologic
quality
and
discrepancies
between
large
and
small
randomized
trials
in
meta-analyses.
Ann
Intern
Med.
2001;135(11):982-989.
2.
Koh
HK,
et.
al.
A
proposed
'health
literate
care
model'
would
constitute
a
systems
approach
to
improving
patients'
engagement
in
care.
Health
Aff
(Millwood).
2013;32(2):
357-367.
3.
Sibbald
B.
and
Roland
M.
Understanding
controlled
trials.
Why
are
randomised
controlled
trials
important?
BMJ.
1998;316(7126):201.
4.
Yusuf
S,
Collins
R,
and
Peto
R.
Why
do
we
need
some
large,
simple
randomized
trials?
Stat
Med.
1984;3(4):
409-422.
5.
Price
DD,
Finniss
DG,
and
Benedetti
F.
A
comprehensive
review
of
the
placebo
effect:
recent
advances
and
current
thought.
Annu
Rev
Psychol.
2008;59:
565-590.
6.
Rajagopal
S.
The
placebo
effect.
The
Psychiatrist.
2006;30:
185-188.
Psychiatric
Bulletin
(2006)30:
185-188doi:
10.1192/pb.30.5.185
7.
Fernald
DH,
Coombs
L,
DeAlleaume
L,
West
D,
and
Parnes
B.
An
Assessment
of
the
Hawthorne
Effect
in
Practice-based
Research.
J
Am
Board
Fam
Med.
2012;25(1):83-86.
8.
Oxman
AD,
Guyatt
GH,
Singer
J,
Goldsmith
CH,
Hutchison
BG,
Milner
RA,
and
Streiner
DL.
Agreement
among
reviewers
of
review
articles.
J
Clin
Epidemiol.
1991;44(1):91-98.
9.
Schulz
KF,
Chalmers
I,
Hayes
RJ,
and
Altman
DG.
Empirical
evidence
of
bias.
Dimensions
of
methodological
quality
associated
with
estimates
of
treatment
effects
in
controlled
trials.
JAMA.
1995;273(5):408-412.
10.
Klein
MC,
Kaczorowski
J,
Robbins
JM,
Gauthier
RJ,
Jorgensen
SH,
and
Joshi
AK.
Physicians'
beliefs
and
behaviour
during
a
randomized
controlled
trial
of
episiotomy:
consequences
for
women
in
their
care.
CMAJ,
1995;153(6):769-779.
11.
Kunz
R,
Vist
G,
and
Oxman
AD.
Randomisation
to
protect
against
selection
bias
in
healthcare
trials.
Cochrane
Database
Syst
Rev.
2007;2:MR000012.
12.
Wood
L,
et.
al.
Empirical
evidence
of
bias
in
treatment
effect
estimates
in
controlled
trials
with
different
interventions
and
outcomes:
meta-epidemiological
study.
BMJ,
2008;
336(7644):601-605.
13.
Altman
D.G.
and
Bland
JM.
Statistics
notes.
Treatment
allocation
in
controlled
trials:
why
randomise?
BMJ.
1999;318(7192):1209.
14.
Altman
DG
and
Bland
JM.
How
to
randomise.
BMJ.
1999;319(7211):703-704.
15.
Schulz
KF.
Subverting
randomization
in
controlled
trials.
JAMA.
1995;274(18):1456-1458.
16.
Swingler
GH.
and
Zwarenstein
M.
An
effectiveness
trial
of
a
diagnostic
test
in
a
busy
outpatients
department
in
a
developing
country:
issues
around
allocation
concealment
and
envelope
randomization.
J
Clin
Epidemiol.
2000;53(7):702-706.
17.
Devereaux
PJ,
et.
al.
Physician
interpretations
and
textbook
definitions
of
blinding
terminology
in
randomized
controlled
trials.
JAMA.
2001;285(15):2000-2003.
18.
Juni
P,
Altman
DG,
and
Egger
M.
Systematic
reviews
in
health
care:
Assessing
the
quality
of
controlled
clinical
trials.
BMJ,
2001;323(7303):42-46.
19.
Schulz
KF
and
Grimes
DA.
Blinding
in
randomised
trials:
hiding
who
got
what.
Lancet.
2002
Feb
23;359(9307):696-700.
20.
Torgerson,
DJ.
Contamination
in
trials:
is
cluster
randomisation
the
answer?
BMJ,
2001;
322(7282):
355-357.
21.
Musahl
V.
et.
al.
The
pivot
shift:
a
global
user
guide.
Knee
Surg
Sports
Traumatol
Arthrosc.
2012;20(4):
724-731.
22.
Whitney
CW
and
Dworkin
SF.
Practical
implications
of
noncompliance
in
randomized
clinical
trials
for
temporomandibular
disorders.
J
Orofac
Pain,
1997;11(2):
130-138.
23.
Snapinn
SM.
Jiang
Q,
and
Iglewicz
B.
Informative
noncompliance
in
endpoint
trials.
Curr
Control
Trials
Cardiovasc
Med.
2004;5(1):5.
24.
Rotnitzky
A,
Lei
Q,
Sued
M,
and
Robins
JM.
Improved
double-robust
estimation
in
missing
data
and
causal
inference
models.
Biometrika.
2012;99(2):439-456.
Inference
and
missing
data.
Biometrika
1976.
63:
p.
581-92.
25.
Bell
ML,
et.
al.
Differential
dropout
and
bias
in
randomised
controlled
trials:
when
it
matters
and
when
it
may
not.
BMJ.
2013;346:e8668.
26.
Dumville
JC,
Torgerson
DJ,
and
Hewitt
CE.
Reporting
attrition
in
randomised
controlled
trials.
BMJ.
2006;332(7547):969-971.
27.
Fergusson
D,
et.
al.
Post-randomisation
exclusions:
the
intention
to
treat
principle
and
excluding
patients
from
analysis.
BMJ.
2002;325(7365):
p.
652-654.
28.
Montori
VM
and
Guyatt
GH.
Intention-to-treat
principle.
CMAJ.
2001;165(10):1339-41.
29.Burzykowski
T,
Carpenter
J,
Coens
C,
Evans
D,
France
L,
Kenward
M,
Lane
P,
Matcham
J,
Morgan
D,
Phillips
A,
Roger
J,
Sullivan
B,
White
I,
Yu
LM;
of
the
PSI
Missing
Data
Expert
Group.
Pharm
Stat.
2010
Oct-Dec;9(4):288-97.
doi:
10.1002/pst.391.
PMID:
19844946
30.
"The
prevention
and
treatment
of
missing
data
in
clinical
trials."
National
Research
Council
(US)
Panel
on
Handling
Missing
Data
in
Clinical
Trials.
Washington
(DC),
US:
National
Academies
Press.
2010.
31.
Gupta
SK.
Intention-to-treat
concept:
A
review.
Perspect
Clin
Res.
2011;2(3):
109-112.
32.
Heritier
SR,
Gebski
VJ,
and
Keech
AC.
Inclusion
of
patients
in
clinical
trial
analysis:
the
intention-to-treat
principle.
Med
J
Aust.
2003;179(8):
438-440.
33.
Newell
DJ.
Intention-to-treat
analysis:
implications
for
quantitative
and
qualitative
research.
Int
J
Epidemiol.
1992;21(5):
837-841.
34.
Coronary
Drug
Project.
Influence
of
adherence
to
treatment
and
response
of
cholesterol
on
mortality
in
the
Coronary
Drug
Project.
N
Engl
J
Med.
1980;303:
1038-1041.
35.
Horwitz
R,
et.al.
Treatment
adherence
and
risk
of
death
after
myocardial
infarction.
Lancet.
1990;336:
542-545.
36.
Altman
DG.
"Clinical
Trials."
Practical
Statistics
for
Medical
Research.
CRC
Press.
1991.
37.
Sommer
A.
and
Zeger
SL.
On
estimating
efficacy
from
clinical
trials.
Stat
Med.
1991;10(1):45-52.
38.
Rubin,
Donald
B.
1976.
Inference
and
missing
data.
Biometrika
63(3):
581-592.
http://nrs.harvard.edu/urn-3:HUL.InstRepos:3408223
39.
Hollis
S.
A
graphical
sensitivity
analysis
for
clinical
trials
with
non-ignorable
missing
binary
outcome.
Stat
Med.
2002;21:3823-3384.
40.
Mazen
Ferwana,
Ashraf
El
Metwally.
How
to
do
Systematic
Review
and
Meta-analysis.
Middle
East
Journal
of
Family
Medicine,
October
2015,
Volume
13,
Issue
7.
41.
Mazen
Ferwana,
Critical
Reading
of
an
Article
about
Causation
and
Harm,
Middle
East
Journal
of
Family
Medicine,
September
2015
,
Volume
13,
Issue
6