|
Brain MRI Findings in
Children (2-4 years old) with Autism
Mohammad Hasan Mohammadi (1)
Farah Ashraf Zadeh (2)
Javad Akhondian (3)
Maryam Hojjati (4)
Mehdi Momennezhad (5)
(1) Child Neurologist, Assistant Professor
of Medical Sciences of Zabol University, Zabol,
Iran
(2) Child Neurologist, Professor of Mashhad
University of Medical Sciences, Mashhad, Iran
(3) Child Neurologist, Professor of Mashhad
University of Medical Sciences, Mashhad, Iran
(4) PhD of Educational Psychology, Director
of Noor Center(Special for children with autism
and developmental disorders)
(5) Nuclear Medicine Research Center, Mashhad
University of Medical Sciences, Mashhad, Iran
Correspondence:
:Farah Ashraf Zadeh
Child Neurologist,
Professor of Mashhad University of Medical Sciences,
Mashhad, Iran
|
Abstract
Autism
is a neurodevelopmental disorder with
a range of clinical presentations, from
mild to severe, that is now classified
in a broader class of disease called ‘‘autism
spectrum disorders’’ (ASD).
The aim of this study was to investigate
Brain MRI findings in children (2-4 years
old) with autism. The sample of the study
included 40 autistic children aged 2 to
4 years whose disease was confirmed by
a fellow psychiatrist based on the diagnostic
criteria of autism spectrum disorders
DSM IV-R. Having explained the study to
parents and after obtaining their consent,
a questionnaire was completed and a three-dimensional
brain MRI was performed for each patient
in the radiology department of Ghaem or
Imam Reza hospitals. From among the 40
patients, 25 patients had a history of
convulsion. Among the other patients,
4 patients (10%) suffered from simple
febrile convulsion (simple FC), 2 cases
from complex febrile convulsion (complex
FC), 6 cases (15%) from TCG and 3 (7.5%)
from Landau–Kleffner syndrome (LKS).
Of the 15 patients with a history of convulsion
disorders, 5 patients (12.5%) used phenobarbital,
4 patients (10%) took valproate and 2
patients (5%) were treated with multi-drug
regimen. Although, we did not measure
white matter connections, lesions in such
neuroanatomic pathways may be causal factors
of behavioral and emotional dysfunctions
in autistic patients. Finally, it is also
important to understand how WMH severity
changes over time.
Key words:
MRI, Brain, Children, Autism
|
Autism is neurodevelopmental disorder with
a range of clinical presentations, from mild
to severe, that is now classified in a broader
class of disease called ‘‘autism spectrum
disorders’’ (ASD). The most common
clinical ASD sign is impaired social interaction,
which is associated with verbal and non-verbal
communication deficits and stereotyped behaviors
[2]. In most cases, it is not presently possible
to detect a known or specific etiology; these
are referred to as non-syndromic autism [1].
The clinical relevance of MR scanning in children
with ASD is still an open question and must
be considered in light of the evolution of this
technology. In 2000, MRI was judged to be of
insufficient value to be included in the standard
clinical evaluation of autism according to the
guidelines of the American Academy of Neurology
and Child Neurology Society [1]. This consensus
stated that the prevalence of lesions detected
by MRI in children with autism has been reported
to be similar to normal control subjects [2].
However, this statement was based on results
obtained from small samples of patients and,
more importantly, included mostly insufficient
MRI sequences. An adequate brain MRI interpretation
must include at least three different sequences
(T1, T2, FLAIR) in three different planes. Yet,
there are few clinical radiological studies
with complete clinical MRI examinations in children
with ASD. For example, in some small groups
of children with ASD, some radiological MRI
anomalies were described, such as accentuated
Virchow–Robin space [3], acrocallosal syndrome
[3], pachygyria [3] macrogyria and polymicrogyria
[3]. However, until now, no reliable data has
been available regarding the prevalence of MRI
abnormalities in a large sample of patients
with non-syndromic ASD.
In addition, in order to determine if the MRI
abnormalities detected in the present population
of children with non-syndromic AD could be also
observed in a normal population of children.
The aim of this study was to investigate Brain
MRI findings in children (2-4 years old) with
autism.
The sample of the study included 40 autistic
children aged 2 to 4 years whose disease was
confirmed by a fellow psychiatrist based on
the diagnostic criteria of autism spectrum disorders
DSM IV-R. Having explained the study to the
parents and obtained their consent, a questionnaire
was completed and a three-dimensional brain
MRI was performed for each patient in the radiology
department of Ghaem or Imam Reza hospitals.
Then brain MRIs were studied by fellow radiologist
and the executor of the project. Brain MRIs
of each patient were compared with the brain
MRI of a child of the same age who did not have
autism spectrum disorders and was under imaging
for any other reason (trauma, infection, headache,
etc.). The volume of frontal lobes and amygdala
in each side were specified and then analyzed.
Quantitative analysis (Statistical Parametric
Mapping = SPM) was employed for volumetry. In
this method, quantitative analysis was Voxel-based
analysis, i.e. Voxels situated in the same spatial
location were compared with each other, and
the value of each voxel represented the probability
of belonging to GM, WM or CSF. The method was
implemented in a toolbox with the same name,
SPM version 8.0. A very important step in quantitative
analysis method of SPM was Normalization. On
the basis of the existing atlases in SPM, MRI
images of healthy and diseased individuals were
normalized in such a way that all images of
this stage were overlapped in terms of spatial
coordinates. To do this step, SPM used Affine
transformation matrix that was specific to each
person under study (healthy and diseased) (44).
Software WFU_PickAtlas version 3.0 and software
Easy Volume were of the features available in
the toolbox SPM. This software was applied for
creating standard mask images based on Talairach
and Tournoux Atlases and calculating the volume
of gas. Among the areas in WFU_PickAtlas, it
could be referred to the areas considered in
the study that included: Amygdala, Frontal Lobe
and whole brain. The atlas was based on MRI
images of a mature and healthy adult. In this
study, the population under study was 2-4 years
old children. That was why the Hammers Atlas
was used here, because it was applied for 2-4
years old children and was available in NIHPD
database (NIH Pediatric MRI Database). Using
the Atlas, indexes of the intended areas were
extracted and standard mask images were created
using image processing toolbox in MATLAB. Changes
in the shape and size (deformation) of the standard
masks had to be so that it could be specifically
used for volumetric of MRI images of patients
under study. For this purpose, affine transformation
matrix described earlier was employed for reverse
conversion. In other words, this matrix that
was specific for each person in the study was
implemented on standard masks to create specific
masks. When these steps were completed, the
software Easy Volume was used to determine the
volume of specific masks.
All children were evaluated by a pediatric
neurologist, a clinical geneticist and a child
psychiatrist. In addition, the recommended biological
and medical screenings for ASD were performed,
including high-resolution karyotyping, DNA analysis
of FRA-X and normal standard metabolic testing
(plasma and urine amino and organic acid analysis,
urine glycosaminoglycans (GAG) quantitation,
urine oligosaccharide, purine and pyrimidine
analysis, and creative guanidoacetate urine
analysis).
MRI was performed with a 1.5 Tesla (Sigma General
Electric) scanner using the following sequences:
3D T1-weighted FSPGR sequence (TR/TE/TI/NEX:
10.5/2.2/600/1, flip angle 10u, matrix size
2566192, yielding 124 axial slices and a thickness
of 1.2 mm, field of view 22 cm), axial and coronal
FSE T2-weighted imaging (TR/TE: 6000/120, 4
mm slices, 0.5 mm gap, field of view 22 cm)
and coronal FLAIR sequences (TR/TETI: 10000/150/2250,
4 mm slices, 1 mm gap, field of view 24 cm).
MRI studies were performed during sleep induced
by premedication (7 mg/kg of sodium pentobarbital)
for all AD children to obtain immobility during
scans. Signal intensities on T1, T2, and proton
density-weighted images relate to specific tissue
characteristics. For example, the changing chemistry
and physical structure of hematomas over time
directly affects the signal intensity on MR
images, providing information about the age
of the haemorrhage. The most common pulse sequences
are the T1- weighted and T2-weighted spin-echo
sequences. The T1-weighted sequence uses a short
TR and short TE (TR, 1000msec, TE, 30msec).
The T2-weighted sequence uses a long TR and
long TE (TR. 2000msec, TE. 80msec). The T2-weighted
sequence can be employed as a dual echo sequence.
The first or shorter echo (TE, 30msec) is proton
density (PD) weighted or a mixture of T1 and
T2. This image is very helpful for evaluating
periventricular pathology, such as multiple
sclerosis, because the hyperintense plaques
are contrasted against the lower signal CSF.
More recently, the FLAIR (Fluid Attenuated Inversion
Recovery) sequence has replaced the PD image.
FLAIR images are T2-weighted with the CSF signal
suppressed. When reviewing an MR image, the
easiest way to determine which pulse sequence
was used, or the ‘‘weighting’’
of the image, is to look at the cerebrospinal
fluid (CSF). If the CSF is bright (high signal),
then it must be a T2-weighted imaged. If the
CSF is dark, it is a T1- weighted or FLAIR image.
Pathologic lesions can be separated into 4 major
groups (solid mass, cyst, blood, fat) by their
specific signal characteristics on the three
basic images: T2- weighted, FLAIR, and T1-weighted.
Since studies have shown that T2- weighted images
are most sensitive for detecting brain pathology,
patients with suspected intracranial disease
should be screened with T2-weighted spin-echo
and FLAIR images. T1-weighted images are needed
only if the preliminary scans suggest hemorrhage,
lipoma, or dermoid. The axial plane is commonly
used because of the familiarity with the anatomy
from CT. Coronal views are good for parasagittal
lesions near the vertex and lesions immediately
above or below the lateral ventricles, temporal
lobes, sella, and internal auditory canals.
The coronal plane can be used as the primary
plane of imaging in patients with temporal lobe
seizures. Sagittal views are useful for midline
lesions (sella, third ventricle, corpus callosum,
pineal region), and for the brainstem and cerebellar
vermis.
Table 1
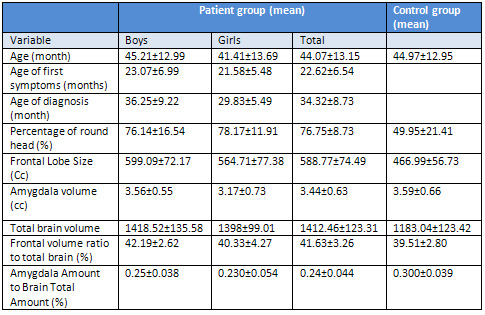
Age at the onset of symptoms and age of diagnosis
Age at the onset of autism symptoms was between
12 and 42 months with an average of 6.54 ±
22.62 months. Age at the onset of symptoms in
autistic boys was between 12 and 42 months with
an average of 6.99 ± 23.07 months and
in autistic girls, between 16 and 36 months
with average of 5.48 ± 21.58 months.
Mann-Whitney nonparametric test revealed a
statistically significant difference (p=.422)
in average age at the onset of symptoms between
girls and boys with autism.
Recent studies have shown that autistic boys
and girls exhibit different behaviors so this
could be the reason.
Age at diagnosis of autism was between 22
to 59 months with an average 73.8 ± 32.34
months. Age of diagnosis of autism among boys
realized to be 24 to 59 months with an average
of 9.22 ± 36.25 months and among girls,
between 22 to 36 months with an average 5.49
± 29.83 months.
Comparison of average age at diagnosis between
girls and boys with autism using the Mann-Whitney
nonparametric test demonstrated a statistically
significant difference between the two groups
(p = .039). On average, the age of diagnosis
in girls was lower.
History of prenatal problems
Out of the 40 patients, 26 patients (65%) had
a history of prenatal complications. From among
other patients, 2 patients (5%) had a history
of neonatal jaundice, 1 patient (5.2%) of preterm
birth, 2 patients (5%) of low Apgar score, three
patients (% 5.7) of labor problems and six others
(15%) of several simultaneous problems.
In the control group, 32 out of 40 patients
(80%) had a history of prenatal complications.
From among the other patients, 5 cases (12.5%)
had a history of neonatal jaundice, 2 cases
(5%) of preterm birth, and one patient (2.5%)
of low Apgar score at birth.
Comparing the two groups in terms of the history
of peripartum problems using chi-square test
showed a statistically significant difference
between them (p = .021).
Family history
Out of the 40 patients, 10 patients (25%) had
a family history of autism spectrum disorders,
while in the control group, only 3 (7.5%) had
a positive family history of autism spectrum
disorders. A comparison between two groups in
terms of family history of autism spectrum disorders
using the chi-square test indicated a statistically
significant difference between the two groups
(p = .034).
Speech disorders and echolalia
In the group of patients, a total of 40 patients
showed a range of speech disorders. 20 out of
40 patients (50%) suffered from echolalia. In
the control group, 4 patients (10%) had a speech
disorder that was associated with hearing impairment.
None of the control group had echolalia.
Comparing the two groups in terms of speech
disorders and echolalia using chi-square test
showed a statistically significant difference
(p <.001).
Head circumference
The investigation of the two groups in terms
of head circumference percentiles showed that
head circumference percentile was between 46
and 99 percentiles with an average of 15.17
± 76.75 percentile in the experimental
group and between 12 to 96 percentiles with
an average of 21.41 ± 49.95 in the control
group, respectively.
Independent t-test indicated that mean head
circumference percentiles between the two groups
was significantly different (p <.001).
The mean head circumference percentile was equal
to 16.54 ± 76.14 and in the range of
46 to 99 and to 11.91 ± 78.17 and in
the range of 60 to 98 among autistic boys and
girls, respectively.
Comparison of mean head circumference percentile
of autistic girls and boys with autism using
independent t-test showed a statistically significant
difference (p = .704).
As a result of the comparison of mean head circumference
percentile between autistic and normal boys
using independent t-test, it was found that
there is a statistically significant difference
between them (p <.001).
Comparison of mean head circumference percentile
among girls with autism and normal girls using
independent t-test indicated a statistically
significant difference (p <.001).
The amygdala
Investigation of the two groups in terms of
the volume of the amygdala revealed that the
volume of the amygdala was between 1.13 to 4.21
ml with an average of 0.63 ± 3.44 ml
in the experimental group and between 55.2 to
47.5 ml with an average of 0.66 ± 3.59
ml in the control group.
Comparison of mean amygdala volume between
the two groups using independent t-test showed
a statistically significant difference between
them (p = .322).
The mean volume of the amygdala in autistic
boys was 0.55 ± 3.56 ml in the range
of 1.23 to 4.21 ml and in autistic girls equal
to 0.73 ± 3.17 ml in the range of 1.13
to 3.70 ml.
Comparing the mean volume of amygdala between
autistic girls and boys using Mann-Whitney test
showed statistically significant difference
between the two groups (p = .049).
Comparing the mean volume of the amygdala between
autistic patients with non-verbal disorder and
other autistic patients using the Mann-Whitney
test demonstrated a statistically significant
difference between the two groups (p = .049).
Mann-Whitney test showed that there was a statistically
significant difference (p = .018) in the mean
volume of the amygdala between autistic patients
with echolilia and other autistic patients.
Independent t-test revealed a statistically
significant difference (p = .697) in the mean
volume of the amygdala between autistic and
normal boys.
Comparison of the mean volume of the amygdala
between autistic and normal girls using independent
t-test showed a statistically significant difference
between the two groups (p = .153).
From
among
the
40
patients,
25
patients
had
a
history
of
convulsion.
Among
the
other
patients,
4
patients
(10%)
suffered
from
simple
febrile
convulsion
(simple
FC),
2
cases
from
complex
febrile
convulsion
(complex
FC),
6
cases
(15%)
from
TCG
and
3
ones
(7.5%)
from
Landau–Kleffner
syndrome
(LKS).
Of
the
15
patients
with
a
history
of
convulsion
disorders,
5
patients
(12.5%)
used
phenobarbital,
4
patients
(10%)
took
valproate
and
2
patients
(5%)
were
treated
with
multi-drug
regimen
(4).
Only
8
cases
(20%)
of
the
40
patients
in
the
control
group
had
complex
FC.
Of
these,
only
one
was
using
phenobarbital.
Comparison
between
the
two
groups
in
terms
of
convulsion
disorders
using
chi-square
test
showed
a
statistically
significant
difference
between
them
(p
<.001)(5)
To
our
knowledge,
the
present
retrospective
study
reports
the
largest
series
of
systematic
visual
analyses
of
MRI
from
patients
with
non-syndromic
AD.
These
patients
have
been
carefully
screened
to
exclude
known
medical
disorders
associated
with
autism.
We
observed
an
unexpectedly
high
prevalence
of
brain
abnormalities
(48%).
This
unexpectedly
high
level
of
anomalies
contrasts
with
the
generally
accepted
view
that
MRI
is
close
to
normal
in
children
with
AD
[6].
This
could
be
explained
by
methodological
improvement,
including
here,
of
considering
MRIs
containing
all
the
acquisitions
necessary
to
detect
brain
abnormalities.
We
found
three
types
of
brain
anomalies,
including
white
matter
hyperintensity
on
T2.FLAIR
sequences,
temporal
lobe
signal
abnormalities
and
dilated
Virchow-Robin
spaces
(7).
Such
abnormalities
were
not
found
in
any
child
in
the
comparison
group,
which
is
in
agreement
with
a
recent
MR
study
in
a
large
group
of
normal
children
[8].
These
abnormalities
cannot
be
detected
when
only
a
T1
sequence
is
acquired.
It
is
important
to
note
that
this
high
prevalence
of
abnormalities
was
found
despite
a
stringent
definition
for
an
abnormal
MRI.
Indeed,
all
minor
anomalies
or
normal
variants
(ventricular
dilatation,
accentuated
Virchow-Robin
spaces,
abnormal
hippocampal
shape,
arachnoid
cysts,
cerebellar
atrophy,
etc.)
were
not
considered
as
abnormal.
Similar
results
were
found
in
a
recent
study
that
included
a
smaller
sample
of
children
with
developmental
disorders,
including
ASD,
with
abnormal
MRI
being
reported
in
49%
of
patients
[9].
In
addition,
Taber
et
al.
have
also
described
high
incidence
of
abnormal
Virchow-Robin
spaces
in
children
and
adolescents
with
ASD
and
normal
IQ
[10].
Our
study
was
subject
to
a
number
of
limitations.
One
intrinsic
limitation
is
that
the
comparison
group
was
not
matched
for
IQ
with
the
AD
group,
which
was
largely
composed
of
children
with
AD
and
mental
retardation.
Therefore,
we
cannot
say
whether
these
MRI
abnormalities
are
specific
to
autism.
Nevertheless,
in
our
series,
the
23
patients
with
normal
IQ
had
the
same
types
of
MRI
abnormalities
as
did
patients
with
AD
and
mental
retardation.
In
idiopathic
mentally
retarded
children,
the
most
frequently
reported
MRI
abnormalities
are
ventricular
dilatation,
arachnoid
cysts,
moderate
subarachnoid
space
enlargement,
cerebellar
atrophy
and/or
cortical
atrophy,
partially
opened
septum
pellucidum
and/or
cavum
vergae
and
corpus
callosum
anomalies
[11].
These
types
of
abnormalities
are
often
considered
to
be
minor
MRI
findings
and
were
not
reported
as
abnormal
in
the
present
study.
Nevertheless,
they
were
rarely
observed
in
the
AD
group
(3%).
Another
limitation
is
that
our
findings
cannot
be
extended
to
persons
with
high-functioning
AD
or
to
the
full
spectrum
of
ASD,
which
covers
very
heterogeneous
disorders.
Therefore,
further
clinical
MRI
investigations
are
necessary
in
these
sub-groups
of
patients.
Finally,
another
important
issue
will
be
to
further
characterize
putative
clinico-radiological
sub-groups
in
AD
and
future
studies
need
to
be
performed.
Certainly,
the
MRI
abnormalities
recognized
in
the
present
study
are
not
specific
to
AD,
since
they
have
been
previously
reported
in
other
neurological,
metabolic
or
genetic
childhood
disorders.
Posterior
periventricular
hyperintensity
was
found
as
a
white
matter
signal
abnormality
in
18.77%
of
the
patients.
Classically,
this
abnormality
can
be
found
in
periventricular
leukomalacia,
metabolic
disorders,
viral
infections
or
vascular
disorders
[12].
White
matter
MRI
abnormalities
were
recently
described
in
a
large
series
of
patients
with
cerebral
palsy
and
were
categorized
into
three
levels
of
severity
from
mild
to
severe;
in
this
study
the
abnormalities
were
always
linked
to
motor
deficits
[13].
The
white
matter
abnormalities
that
we
have
found
in
children
with
autism
are
comparable
to
the
mild
to
moderate
levels
described
in
cerebral
palsy,
but
no
motor
deficits
were
observed
in
our
AD
patients.
Isolated
or
associated
white
matter
abnormalities
were
found
in
30.77%
children
with
autism
in
our
series.
They
could
represent
injury
to
the
brain
parenchyma
and
resultant
disruption
of
neural
circuitry.
The
main
question
is
which
different
mechanisms
may
be
involved
in
the
emergence
of
such
white
matter
abnormalities
(14).
It
is
highly
possible
that
these
white
matter
hyperintensities
(WMH)
might
simply
represent
the
‘tip
of
the
iceberg’
in
terms
of
structural
white
matter
lesions.
Thus,
the
presence
and
severity
of
white-matter
hyperintensities
associated
with
autism
might
be
understood
as
an
extreme
consequence
of
underlying
microstructural
processes
that
affect
brain
connectivity
and
which
may
be
more
specifically
investigated
using
diffusion
tensor
imaging
methods.
WMH,
depending
on
the
localization,
are
commonly
classified
as
periventricular
hyperintensities
(PVH)
or
deep
white
matter
hyperintensities
(DWMH)(15).
Deep
white
matter
hyperintensities
were
identified
as
having
mainly
a
vascular
etiology,
and
periventricular
hyperintensities
could
be
due
to
ependymal
loss,
differing
degrees
of
myelination
and
cerebral
ischemia.
WMH
are
reported
to
be
commonly
associated
with
older
age,
and
cardiovascular
risk
factors
such
as
hypertension
and
diabetes.
Lesions
in
one
specific
part
or
disruption
of
interconnections
among
areas
regulating
social
and
communication
cognition
could
trigger
the
onset
of
autistic
symptoms.
Furthermore,
posterior
white
matter
connections
with
the
temporal
regions
could
be
of
particular
importance
to
social
disturbances
in
autism.
Although,
we
did
not
measure
white
matter
connections,
lesions
in
such
neuroanatomic
pathways
may
be
causal
factors
of
behavioral
and
emotional
dysfunctions
in
autistic
patients.
Finally,
it
is
also
important
to
understand
how
WMH
severity
changes
over
time.
1.
Association
AP.
Diagnostic
and
statistical
manual
of
mental
disorders
(DSM-5®):
American
Psychiatric
Pub;
2013.
2.
Rice
C.
Prevalence
of
Autism
Spectrum
Disorders:
Autism
and
Developmental
Disabilities
Monitoring
Network,
United
States,
2006.
Morbidity
and
Mortality
Weekly
Report.
Surveillance
Summaries.
Volume
58,
Number
SS-10.
Centers
for
Disease
Control
and
Prevention.
2009.
3.
Mosconi
MW,
Cody-Hazlett
H,
Poe
MD,
Gerig
G,
Gimpel-Smith
R,
Piven
J.
Longitudinal
study
of
amygdala
volume
and
joint
attention
in
2-to
4-year-old
children
with
autism.
Archives
of
general
psychiatry.
2009;66(5):509-16.
4.
Swaiman
KF,
Ashwal
S,
Ferriero
DM,
Schor
NF.
Swaiman’s
pediatric
neurology:
principles
and
practice:
Elsevier
Health
Sciences;
2011.
5.
Association
AP,
Association
AP.
Diagnostic
and
statistical
manual-text
revision
(DSM-IV-TRim,
2000):
American
Psychiatric
Association;
2000.
6.
Allen
DA.
Autistic
Spectrum
Disorders:
clinical
presentation
in
preschool
children.
Journal
of
Child
Neurology.
1988;3(1
suppl):S48-S56.
7.
Baio
J.
Prevalence
of
Autism
Spectrum
Disorders:
Autism
and
Developmental
Disabilities
Monitoring
Network,
14
Sites,
United
States,
2008.
Morbidity
and
Mortality
Weekly
Report.
Surveillance
Summaries.
Volume
61,
Number
3.
Centers
for
Disease
Control
and
Prevention.
2012.
8.
Matsuishi
T,
Yamashita
Y,
Ohtani
Y,
Ornitz
E,
Kuriya
N,
Murakami
Y,
et
al.
Brief
report:
incidence
of
and
risk
factors
for
autistic
disorder
in
neonatal
intensive
care
unit
survivors.
Journal
of
Autism
and
Developmental
Disorders.
1999;29(2):161-6.
9.
Badawi
N,
Dixon
GS,
Felix
JF,
Keogh
JM,
Petterson
B,
Stanley
FJ,
et
al.
Autism
following
a
history
of
newborn
encephalopathy:
more
than
a
coincidence?
Developmental
Medicine
&
Child
Neurology.
2006;48(2):85-9.
10.
Juranek
J,
Filipek
PA,
Berenji
GR,
Modahl
C,
Osann
K,
Spence
MA.
Association
between
amygdala
volume
and
anxiety
level:
magnetic
resonance
imaging
(MRI)
study
in
autistic
children.
Journal
of
child
neurology.
2006;21(12):1051-8.
11.
Courchesne
E,
Karns
C,
Davis
H,
Ziccardi
R,
Carper
R,
Tigue
Z,
et
al.
Unusual
brain
growth
patterns
in
early
life
in
patients
with
autistic
disorder
an
MRI
study.
Neurology.
2001;57(2):245-54.
12.
Chugani
D.
Role
of
altered
brain
serotonin
mechanisms
in
autism.
Molecular
Psychiatry.
2002;7:S16.
13.
Chen
W,
Landau
S,
Sham
P,
Fombonne
E.
No
evidence
for
links
between
autism,
MMR
and
measles
virus.
Psychological
medicine.
2004;34(03):543-53.
14.
Auranen
M,
Vanhala
R,
Varilo
T,
Ayers
K,
Kempas
E,
Ylisaukko-oja
T,
et
al.
A
genomewide
screen
for
autism-spectrum
disorders:
evidence
for
a
major
susceptibility
locus
on
chromosome
3q25-27.
The
American
Journal
of
Human
Genetics.
2002;71(4):777-90.
15.
Akshoomoff
N,
Farid
N,
Courchesne
E,
Haas
R.
Abnormalities
on
the
neurological
examination
and
EEG
in
young
children
with
pervasive
developmental
disorders.
Journal
of
autism
and
developmental
disorders.
2007;37(5):887-93.
|